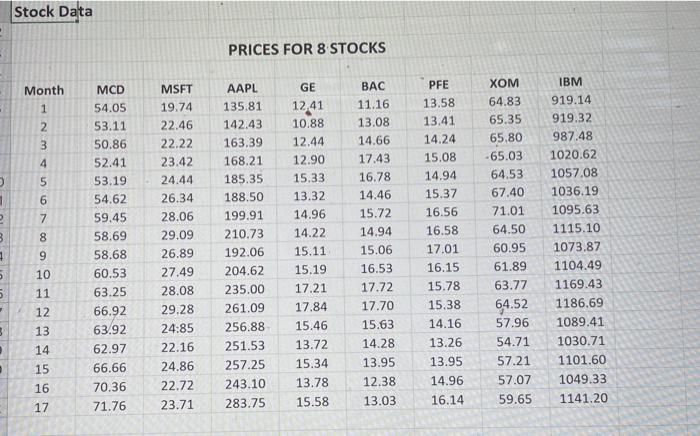
The Excel file Stock Data contains monthly price data for eight (8) stocks. a. Use continuous returns and the Matrix of Excess Returns to compute the Variance- Covariance Matrix for these eight (8) stocks. (Do not use the varcovar VBA function). b. Use the Variance - Covariance Matrix for these eight (8) stocks to compute the individual stock proportions for the Global Minimum Variance Portfolio (GMVP). Calculate the expected Return and Risk (Standard Deviation) for the Global Minimum Variance Portfolio (GMVP). c. Stock Data PRICES FOR 8 STOCKS Month 1 2 3 4 00 N 5 1 6 MCD 54.05 53.11 50.86 52.41 53.19 54.62 59.45 58.69 58.68 60.53 63.25 66.92 63.92 62.97 66.66 70.36 71.76 7 MSFT 19.74 22.46 22.22 23.42 24.44 26.34 28.06 29.09 26.89 27.49 28.08 29.28 24.85 22.16 24.86 22.72 23.71 XOM 64.83 65.35 65.80 -65.03 64.53 67.40 71.01 64.50 60.95 61.89 63.77 GE 1241 10.88 12.44 12.90 15.33 13.32 14.96 14.22 15.11 15.19 17.21 17.84 15.46 13.72 AAPL 135.81 142.43 163.39 168.21 185.35 188.50 199.91 210.73 192.06 204.62 235.00 261.09 256.88 251.53 257.25 243.10 283.75 PFE 13.58 13.41 14.24 15.08 14.94 15.37 16.56 16.58 17.01 16.15 15.78 15,38 3 BAC 11.16 13.08 14.66 17.43 16.78 14.46 15.72 14.94 15.06 16.53 17.72 17.70 15.63 14.28 13.95 12.38 13.03 IBM 919.14 919.32 987.48 1020.62 1057.08 1036.19 1095.63 1115.10 1073.87 1104.49 1169.43 1186.69 1089.41 1030.71 1101.60 1049.33 1141.20 1 9 10 5 11 64.52 57.96 3 12 13 14 15 54.71 15.34 14.16 13.26 13.95 14.96 16.14 57.21 57.07 59.65 16 13.78 15.58 17 The Excel file Stock Data contains monthly price data for eight (8) stocks. a. Use continuous returns and the Matrix of Excess Returns to compute the Variance- Covariance Matrix for these eight (8) stocks. (Do not use the varcovar VBA function). b. Use the Variance - Covariance Matrix for these eight (8) stocks to compute the individual stock proportions for the Global Minimum Variance Portfolio (GMVP). Calculate the expected Return and Risk (Standard Deviation) for the Global Minimum Variance Portfolio (GMVP). c. Stock Data PRICES FOR 8 STOCKS Month 1 2 3 4 00 N 5 1 6 MCD 54.05 53.11 50.86 52.41 53.19 54.62 59.45 58.69 58.68 60.53 63.25 66.92 63.92 62.97 66.66 70.36 71.76 7 MSFT 19.74 22.46 22.22 23.42 24.44 26.34 28.06 29.09 26.89 27.49 28.08 29.28 24.85 22.16 24.86 22.72 23.71 XOM 64.83 65.35 65.80 -65.03 64.53 67.40 71.01 64.50 60.95 61.89 63.77 GE 1241 10.88 12.44 12.90 15.33 13.32 14.96 14.22 15.11 15.19 17.21 17.84 15.46 13.72 AAPL 135.81 142.43 163.39 168.21 185.35 188.50 199.91 210.73 192.06 204.62 235.00 261.09 256.88 251.53 257.25 243.10 283.75 PFE 13.58 13.41 14.24 15.08 14.94 15.37 16.56 16.58 17.01 16.15 15.78 15,38 3 BAC 11.16 13.08 14.66 17.43 16.78 14.46 15.72 14.94 15.06 16.53 17.72 17.70 15.63 14.28 13.95 12.38 13.03 IBM 919.14 919.32 987.48 1020.62 1057.08 1036.19 1095.63 1115.10 1073.87 1104.49 1169.43 1186.69 1089.41 1030.71 1101.60 1049.33 1141.20 1 9 10 5 11 64.52 57.96 3 12 13 14 15 54.71 15.34 14.16 13.26 13.95 14.96 16.14 57.21 57.07 59.65 16 13.78 15.58 17