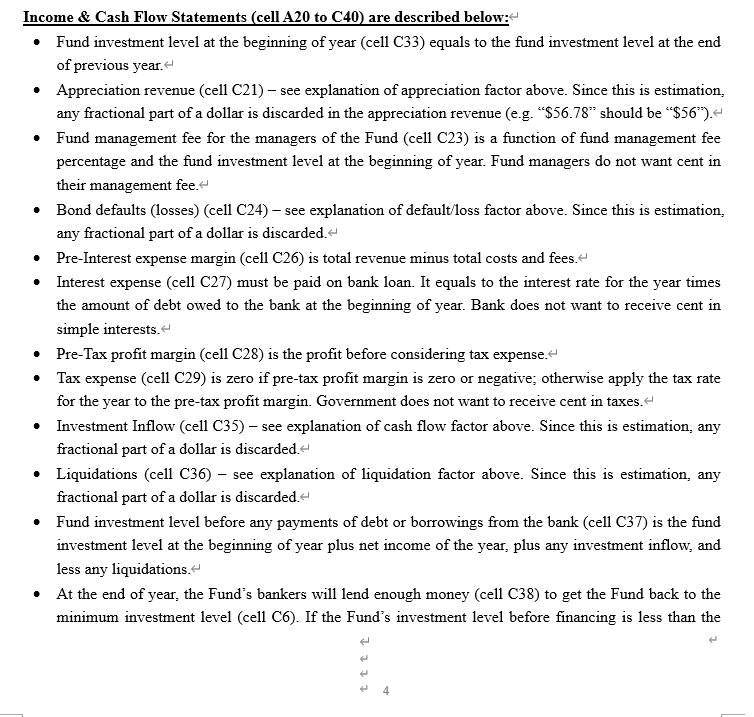
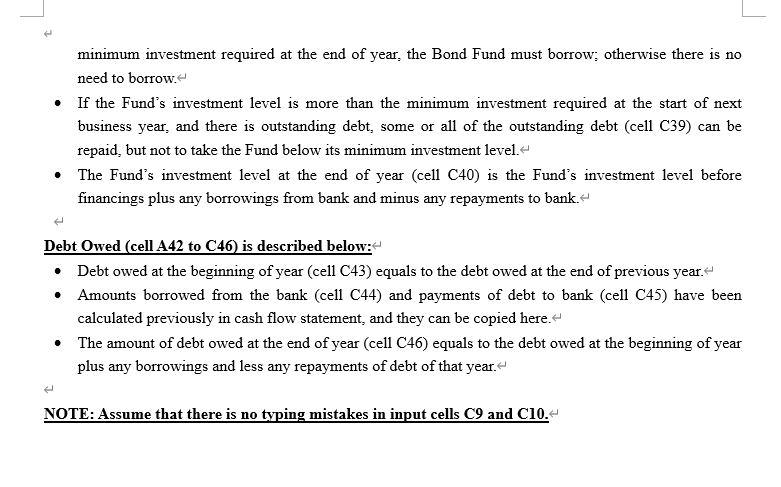
The excel sheet is at the bottom of the page, thx
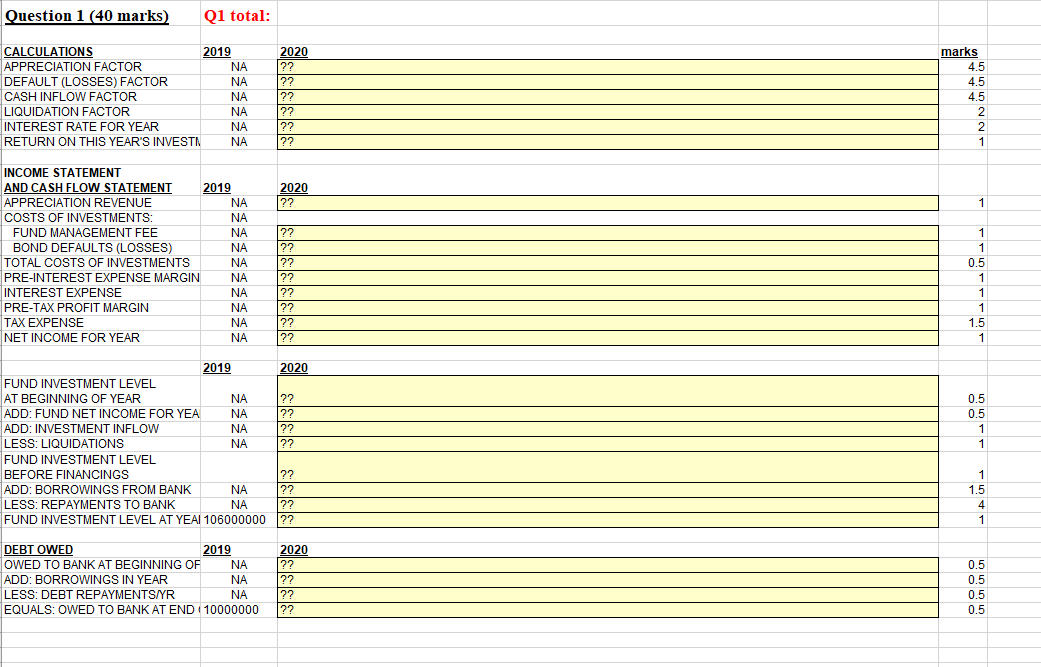
Question 1 (40 marks)- Refer to Figure 1. Write the Excel formula for each cell marked with "??" in column C, and label each formula clearly with cell reference position. TUV Investment Company manages a family of mutual funds. TUV recently started a new fund called the Bond Fund at the end of year 2019. For year 2020, the Bond Fund's management wants to know if they should choose high or low risk investments, and how their choice might be affected by a changing economy. High risk and high reward (or interests) go hand-in-hand. Companies in high-risk industries must offer high interest rates on bonds they issue to attract investors, who know that the chance of default (or loss) is greater with high-risk companies. By contrast, companies in low-risk industries can offer lower interest rates. For example, U.S. Government bonds have very low risks because U.S. Government can't default or bankrupt. Bonds issued by some blue-chip companies may have high risks because these companies may default or bankrupt at any time. Another factor affecting interest rates is the general state of economy. In a good economy, companies compete for capital, so interest rates offered to investors go up. In a recession economy, interest rates go down. In a good economy, defaults are less likely. In a recession economy, companies have trouble making ends meet, and the chance of defaults increase. You are required to make a what-if analysis ttt in Microsoft Excel (see Figure 1) to help TUV's Bond Fund management consider the merits of different investment alternatives. "Given an estimate of the economy and given the two possible investment policies- high and low risks, what will TUV's net profit be in year 2020, and what will the fund investment level and bank debt be at the end of year 2020?" Different possible economic estimates and risk levels are entered in cells C9 and C10:4 Economic outlook (C9) has three values: G for good, N for neutral, R for recession. Fund risk level (C10) has 2 values: H for high risk, S for safe policy. ~You are required to write Excel formulas in cells C13 to C46 (figure 1) for this what-if analysis forecast. The forecast is based on 2019's values, such as fund investment level at the end of year 2019 (cell B40), and debt owed at the end of year 2019 (cell B46).~ To understand the operation in TUV, here is some background information on TUV.~ In late 2019. Fund managers started the Fund with $100 million, which was financed by having $10 million borrowed from (or owed to) the bank and $90 million invested from Fund's investors. The Fund managers invested in securities, and sold shares in the Fund, and the net income for year 2019 was $6 million. Thus the return on the initial investment was 6%, which is the "Return on This Year's Investment" (ROD) in cell C18 - net income divided by total dollars invested at the start of year. At the end of year 2019, the Fund investment level was $106 million, which was reinvested in the following year. Managers of the Bond Fund charge the Fund 1% (cell C4) of the total dollars invested as management fee, which forms part of Fund managers' salaries. However, this management fee is an expense to the Fund. Other Fund expenses include taxes, and losses when bond issuers default because of bankruptcy. Bond Fund managers gain money to invest in bonds in three ways+ Net income from previous years reinvested in new bonds.~ Investors send in money for units of the Bond Fund; this is called "inflow factor". Bond Fund managers borrow money from the bank if total dollars in Bond Fund at the end of year fall below $100 million, which is the minimum fund investment dollars at the beginning of year 2020 (cell (6). ~ The Bond Fund's total invested dollars could be reduced in two ways: Investors cash out their units, and fund managers must liquidate some Fund investments to pay these investors. This is called the "liquidation factor". A bond issuer defaults, announcing it is not going to repay its debt. This means that the now-worthless investment must be written off as an expense in the Fund income statement. The following constants (cell A3 to C6) for the forecast are described below:- The Fund's management fee is 1% (cell C4) of the total dollars invested at the beginning of year 2020.~ The government tax rate on pre-tax profit is in cell C5.~ TUV's policy is to have at least $100 million in cash on hand at the end of each financial year in orderto continue the Bond Fund for the next year. This is called the minimum fund investment dollars required at the start of financial year - cell C6. TUV will obtain bank loans if there is insufficient cash to meet this minimum amount. ~ Calculations (cell A12 to C19) are described below:- This part considers some factors and calculates intermediate results necessary for the Income & Cash Flow Statement. These calculations are based on the input values in cell C9 and C10.~ . Appreciation factor (cell C13): This is the average investment interest rate in a year. The investment portfolio "appreciates" (or earns income) at this average interest rate. The better the economy and the higher the risk taken, the higher the appreciation factor. The table below shows the estimated appreciation factor in six possible situations: Good Economye Neutral Economye Recession Economy High Risk Policye 14% 12% 10%% Safe Policye 10% 9%+ 9%% For example: Assume $100,000,000 is invested at the start of year. With a Good Economy and a High Risk Policy, the average interest rate on money invested is 14%, and appreciation revenue (cell C21) would be $14,000,000 in the income statement. . Default (Losses) factor (cell C14): This is an estimated % of investment dollars that will be defaulted. The table below shows the average loss rate for year 2020 in six possible situations: Good Economye Neutral Economye Recession Economy+ High Risk Policye 1%% 3%% 5%+ Safe Policye 1%+ 1% 2%+ For example: Assume $100,000,000 is invested at the start of year. With a Recession Economy and a High Risk Policy. the average loss rate on money invested is 5%, and bond defaults/losses (cell C24) would be $5,000,000 in the income statement. Cash inflow factor (cell C15): The willingness of investors to buy more units of the Bond Fund depends on the economy and the Bond Fund's prior year ROI. Potential investors watch closely the ROI as a performance measure of the Bond Fund. The better the economy and the better the prior year's ROI, the higher the cash inflow. The table below shows the estimated rate of cash inflow in sixpossible situations: Good Economye Neutral Economye Recession Economy. Prior Year ROI > 0.05+ 10% 8%+ 8%+ Prior Year ROI
