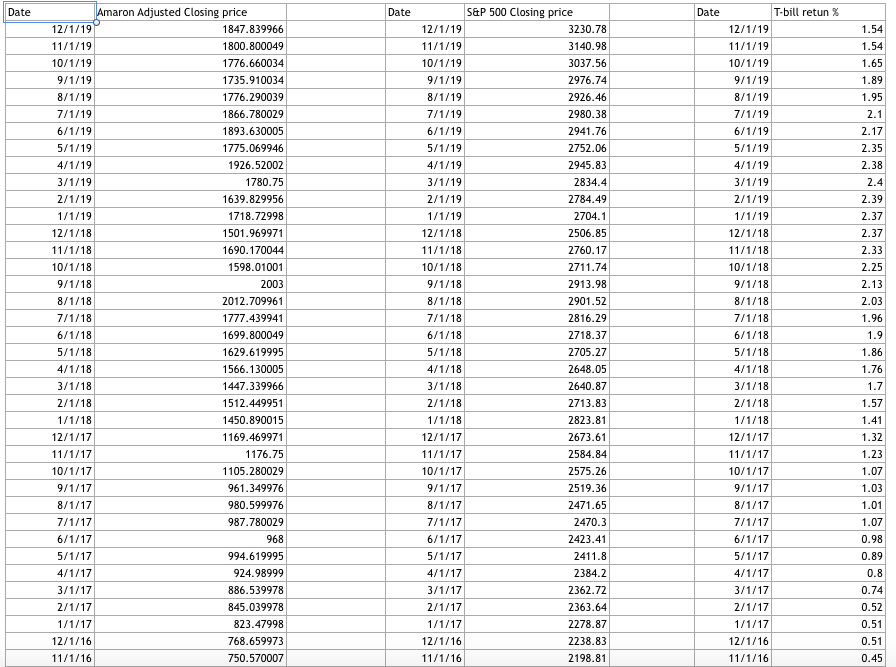
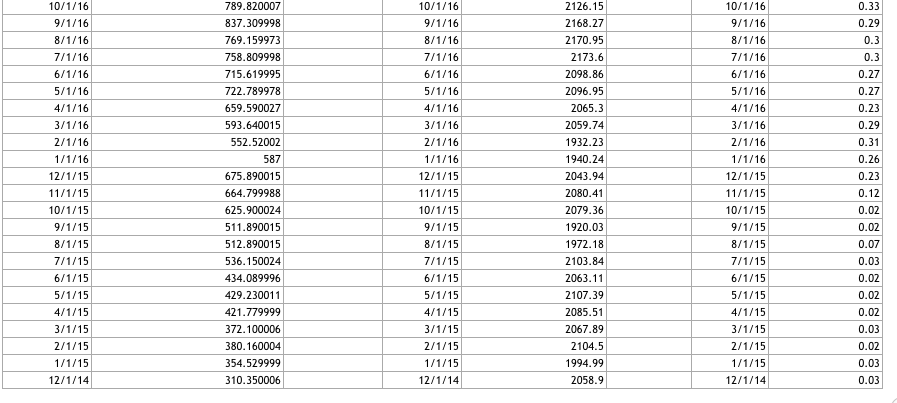
The excel spreadsheet provided gives you Amazons monthly prices for 60 months from 12/01/2014 to 12/01/2019. You are also given the S&P 500 indexs corresponding
The excel spreadsheet provided gives you Amazons monthly prices for 60 months from 12/01/2014 to 12/01/2019. You are also given the S&P 500 indexs corresponding monthly prices. Use the S&P 500 to proxy for the market. You are also given the 3 months treasury bills percentage return over the period. The T-bill return represents the risk-free rate. You want to know how Amazon moves compared to the market. To do so, you need to estimate the stocks beta. Using Excel, perform a regression analysis that examines the relationship between the Amazon risk premium and the S&P 500s risk premium.


Need to understand how to plug into Excel to answer the following types of questions:
1) What is Amazons return on 12/01/2019? a. -4.87% b. 6.67% c. 2.61% d. 4.05%
2) What is the S&P 500s return on 12/01/2019? a. 2.85% b. -1.80% c. 8.59% d. 7.86%
3) What is Amazons return on 01/01/2015? a. 13.35% b. 14.23% c. 7.76% d. 5.48%
4) What is the S&P 500s return on 01/01/2015? a. -6.25% b. 8.29% c. -3.10% d. -5.70%
5) What is Amazons risk premium on 12/01/2019? a. 0.69% b. 1.07% c. 6.19% d. 11.2%
6) What is the S&Ps 500 risk premium on 12/01/2019? a. 0.58% b. 0.39% c. -1.7% d. 1.32%
7) What is Amazons risk premium on 01/01/2015? a. 14.20% b. 12.63% c. 23.84% d. 17.89
8) What is the S&P 500s risk premium on 01/01/2015? a. 1.03% b. -6.33% c. -3.13% d. 0.83%
9) What is Amazons beta? a. 2.667 b. 1.56 c. 0.79 d. 2.33
10) Is Amazon riskier than the market? a. Yes, Amazon seems to be riskier than the market b. No, Amazon seems less risky than the market
Date Date Date Amaron Adjusted Closing price 12/1/19 1847.839966 11/1/19 1800.800049 10/1/19 1776.660034 9/1/19 1735.910034 8/1/19 1776.290039 7/1/19 1866.780029 6/1/19 1893.630005 5/1/19 1775.069946 4/1/19 1926.52002 3/1/19 1780.75 2/1/19 1639.829956 1/1/19 1718.72998 12/1/18 1501.969971 11/1/18 1690.170044 10/1/18 1598.01001 9/1/18 2003 8/1/18 2012.709961 7/1/18 1777.439941 6/1/18 1699.800049 5/1/18 1629.619995 4/1/18 1566.130005 3/1/18 1447.339966 2/1/18 1512.449951 1/1/18 1450.890015 12/1/17 1169.469971 11/1/17 1176.75 10/1/17 1105.280029 9/1/17 961.349976 8/1/17 980.599976 7/1/17 987.780029 6/1/17 968 5/1/17 994.619995 4/1/17 924.98999 3/1/17 886.539978 2/1/17 845.039978 1/1/17 823.47998 12/1/16 768.659973 11/1/16 750.570007 S&P 500 Closing price 12/1/19 3230.78 11/1/19 3140.98 10/1/19 3037.56 9/1/19 2976.74 8/1/19 2926.46 7/1/19 2980.38 6/1/19 2941.76 5/1/19 2752.06 4/1/19 2945.83 3/1/19 2834.4 2/1/19 2784.49 1/1/19 2704.1 12/1/18 2506.85 11/1/18 2760.17 10/1/18 2711.74 9/1/18 2913.98 8/1/18 2901.52 7/1/18 2816.29 6/1/18 2718.37 5/1/18 2705.27 4/1/18 2648.05 3/1/18 2640.87 2/1/18 2713.83 1/1/18 2823.81 12/1/17 2673.61 11/1/17 2584.84 10/1/17 2575.26 9/1/17 2519.36 8/1/17 2471.65 7/1/17 2470.3 6/1/17 2423.41 5/1/17 2411.8 4/1/17 2384.2 3/1/17 2362.72 2/1/17 2363.64 1/1/17 2278.87 12/1/16 2238.83 11/1/16 2198.81 T-bill retun % 12/1/19 11/1/19 10/1/19 9/1/19 8/1/19 7/1/19 6/1/19 5/1/19 4/1/19 3/1/19 2/1/19 1/1/19 12/1/18 11/1/18 10/1/18 9/1/18 8/1/18 7/1/18 6/1/18 5/1/18 4/1/18 3/1/18 2/1/18 1/1/18 12/1/17 11/1/17 10/1/17 9/1/17 8/1/17 7/1/17 6/1/17 5/1/17 4/1/17 3/1/17 2/1/17 1/1/17 12/1/16 11/1/16 1.54 1.54 1.65 1.89 1.95 2.1 2.17 2.35 2.38 2.4 2.39 2.37 2.37 2.33 2.25 2.13 2.03 1.96 1.9 1.86 1.76 1.7 1.57 1.41 1.32 1.23 1.07 1.03 1.01 1.07 0.98 0.89 0.8 0.74 0.52 0.51 0.51 0.45 10/1/16 9/1/16 8/1/16 7/1/16 6/1/16 5/1/16 4/1/16 3/1/16 2/1/16 1/1/16 12/1/15 11/1/15 10/1/15 9/1/15 8/1/15 7/1/15 6/1/15 5/1/15 4/1/15 3/1/15 2/1/15 1/1/15 12/1/14 789.820007 837.309998 769.159973 758.809998 715.619995 722.789978 659.590027 593.640015 552.52002 587 675.890015 664.799988 625.900024 511.890015 512.890015 536.150024 434.089996 429.230011 421.779999 372.100006 380.160004 354.529999 310.350006 10/1/16 9/1/16 8/1/16 7/1/16 6/1/16 5/1/16 4/1/16 3/1/16 2/1/16 1/1/16 12/1/15 11/1/15 10/1/15 9/1/15 8/1/15 7/1/15 6/1/15 5/1/15 4/1/15 3/1/15 2/1/15 1/1/15 12/1/14 2126.15 2168.27 2170.95 2173.6 2098.86 2096.95 2065.3 2059.74 1932.23 1940.24 2043.94 2080.41 2079.36 1920.03 1972.18 2103.84 2063.11 2107.39 2085.51 2067.89 2104.5 1994.99 2058.9 10/1/16 9/1/16 8/1/16 7/1/16 6/1/16 5/1/16 4/1/16 3/1/16 2/1/16 1/1/16 12/1/15 11/1/15 10/1/15 9/1/15 8/1/15 7/1/15 6/1/15 5/1/15 4/1/15 3/1/15 2/1/15 1/1/15 12/1/14 0.33 0.29 0.3 0.3 0.27 0.27 0.23 0.29 0.31 0.26 0.23 0.12 0.02 0.02 0.07 0.03 0.02 0.02 0.02 0.03 0.02 0.03 0.03Step by Step Solution
There are 3 Steps involved in it
Step: 1

See step-by-step solutions with expert insights and AI powered tools for academic success
Step: 2

Step: 3

Ace Your Homework with AI
Get the answers you need in no time with our AI-driven, step-by-step assistance
Get Started


