The Exel is used to solve the question. 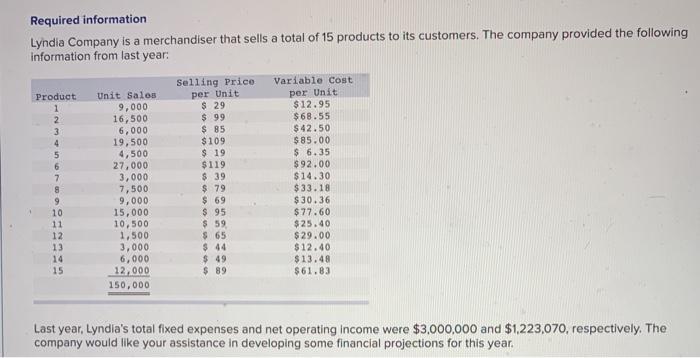
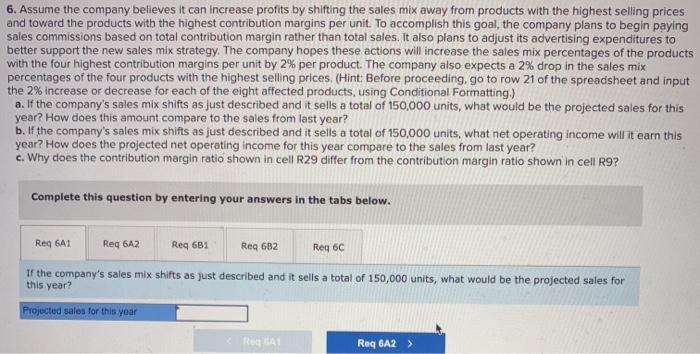
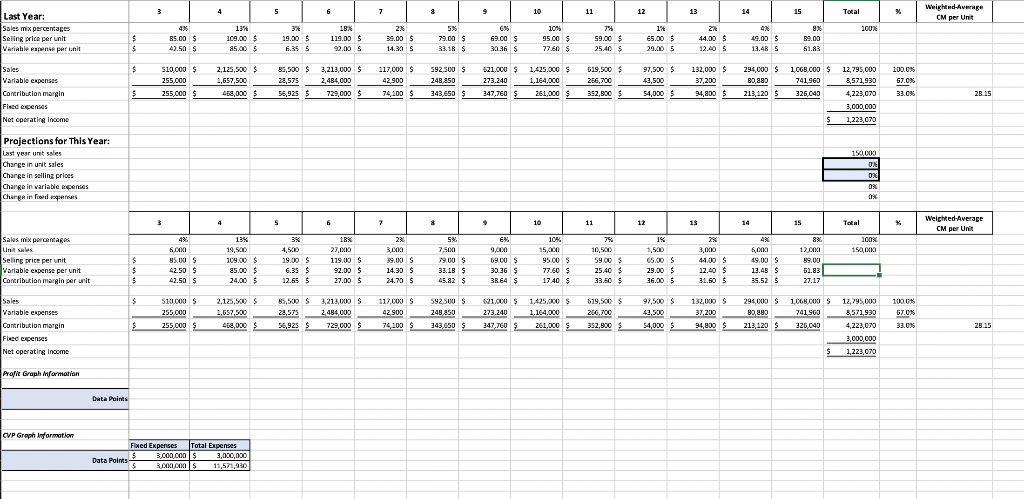
Required information Lyndia Company is a merchandiser that sells a total of 15 products to its customers. The company provided the following information from last year: Selling Price Variable Cost Product Unit Sales per Unit per Unit 9,000 $ 29 $12.95 2 16,500 $ 99 $68.55 3 6,000 $ 85 $42.50 4 19,500 $109 $85.00 5 4,500 $ 19 $ 6.35 6 27,000 $119 $92.00 7 3,000 $ 39 $14.30 8 7,500 $ 79 $33.18 9,000 $ 69 $30.36 10 15,000 $ 95 $77.60 11 10,500 $ 59 $25.40 12 1,500 $ 65 $29.00 13 3,000 $ 44 $12.40 14 6,000 $ 49 $13.48 15 12.000 $ 89 $61.83 150,000 Last year. Lyndia's total fixed expenses and net operating income were $3,000,000 and $1,223,070, respectively. The company would like your assistance in developing some financial projections for this year. 6. Assume the company believes it can increase profits by shifting the sales mix away from products with the highest selling prices and toward the products with the highest contribution margins per unit. To accomplish this goal, the company plans to begin paying sales commissions based on total contribution margin rather than total sales. It also plans to adjust its advertising expenditures to better support the new sales mix strategy. The company hopes these actions will increase the sales mix percentages of the products with the four highest contribution margins per unit by 2% per product. The company also expects a 2% drop in the sales mix percentages of the four products with the highest selling prices. (Hint: Before proceeding, go to row 21 of the spreadsheet and input the 2% increase or decrease for each of the eight affected products, using Conditional Formatting) a. If the company's sales mix shifts as just described and it sells a total of 150,000 units, what would be the projected sales for this year? How does this amount compare to the sales from last year? b. If the company's sales mix shifts as just described and it sells a total of 150,000 units, what net operating income will it earn this year? How does the projected net operating income for this year compare to the sales from last year? c. Why does the contribution margin ratio shown in cell R29 differ from the contribution margin ratio shown in cell R9? Complete this question by entering your answers in the tabs below. Req 6A1 Req 6A2 Req 681 Req6B2 Req 6C If the company's sales mix shifts as just described and it sells a total of 150,000 units, what would be the projected sales for this year? Projected sales for this year Req 6A2 > 3 4 5 6 7 8 9 10 11 12 13 15 Total % Weighted Average CM per Unit Last Year: Sales mix percentages Selling price per unit Variable pense per unit 100% $ $ 35.00 $ 42.50 $ 13% 109.00 $ 85.00 $ 34 19.00 $ 6.35 $ 132 119.00 $ 92.00 $ 2x 39.00 $ 14.30 $ 5% 79.00 $ 33.18 $ G 69.00 $ 32.36 $ 10% 95.00 $ 77.60 $ 59.00 $ 25.40 $ 14 65.00 $ 29.00 $ 44.00 $ 12.40 $ 49.00 $ 13.4R S 89.00 61.83 $ 132,000 510.000 $ 255.000 2,125,500 $ 1,657,500 458,000 $ Sales Variable expenses Contribution mangin Fleed expenses Net operating income 55,500 $ 3.212.000 $ 28,575 2,484,000 56,925 $ 729,000 $ 117,000 $ 42,900 74100 $ 592.500 5 248.850 621,000 $ 273.240 347,760 $ 1.425.000 $ 1,164,000 261.000 $ 619,500 $ 266,700 352,800 $ 97,500S 43,500 54,000 $ 294,000 $ 89,880 213,120 $ 100.0% 57.0 33.0% $ 255.000 $ 343,650 $ 1,068,000 $ 12,795,000 741,360 8.571,930 325.040 4,223,070 3,000,000 $ 1,221,070 94,800 $ 28.15 Projections for This Year: Last year unt sales Charge in unit sales Change in selling prices Change in variable contes Charge in Pied perses 150,000 OX 0% 0% 08 3 4 4 5 5 6 7 9 10 11 13 12 14 15 Total * Weighted Average CM per Une 1% 100% 150,000 10,500 Sales mix percentages unit sales Selling price per unit Variable expense per unit Contribution mangin per unit S $ $ 6.000 85.00 $ 42.50 $ 42.50 $ 13% 19,500 109.00 $ 85.00 $ 24.00 $ 4,500 19.00 S 6.35 $ 12.55$ 18% 27,000 119.00 S 92.00 $ 27.00 $ 296 3.000 39.00 S 14.30 $ 24.70 $ 5% 7,500 29.00 $ 33.18 $ 45.82 $ EX 9,000 69.00 5 30.36 $ 38.64 $ 104 15.000 95.00 5 77.60 $ 17.40 $ 3,000 44.00 S 12.40 $ S 31.50$ 65.00 $ 29.00 $ 36.00 $ 6.000 49.00 S 13.45 $ 35.52 12.000 89.00 51.83 27.17 25.40 $ 33,0 $ $ Sales Variable expenses Contribution margin Fixed ecenses Net operating Income 510.000 255.000 255.000 2.125,500 5 1,657.500 468,000 $ 55,500 S 3,213,000 S 2.450,000 56,925 S 729,000 $ 117,000 $ 42.900 74100 $ 592.500 5 249,850 343.650 $ 121.000 5 1.425.000 273.240 1.164.000 347,7605 261.000 $ 619.500 5 266.700 352.900 97,500S 43,500 132,000 294 000 $ 37,200 90.800 94,800 $ 213120 213S 1.068.000 S 741960 326,040 1000 67.0% 33.0% $ 12,295,000 8571930 4,223,070 3,000,000 1,223,070 54,000 $ 28.15 $ Profit Graph formation Data Polres CVP Graph armation Fixed Expenses Total Expenses $ 3.000.000 $ 3,000,000 Data Points 3.000.000 11,571,930