Answered step by step
Verified Expert Solution
Link Copied!

Question

1 Approved Answer

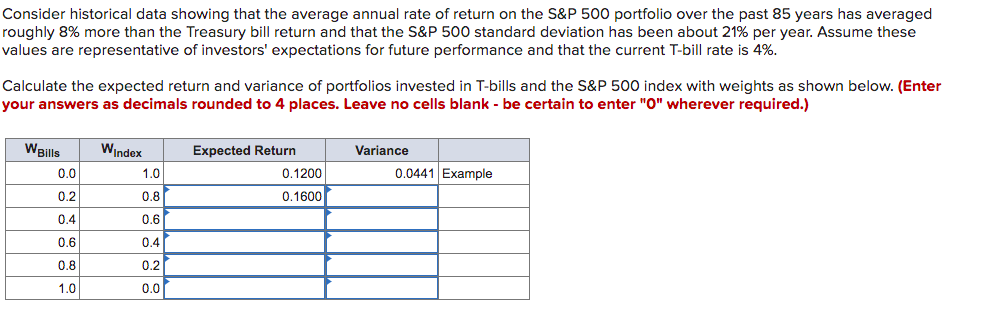
the expected return and variance answer I put are wrong Consider historical data showing that the average annual rate of return on the S&P 500

the expected return and variance answer I put are wrong

image text in transcribed

Consider historical data showing that the average annual rate of return on the S&P 500 portfolio over the past 85 years has averaged roughly 8% more than the Treasury bill return and that the S&P 500 standard deviation has been about 21% per year. Assume these values are representative of investors' expectations for future performance and that the current T-bill rate is 4%. Calculate the expected return and variance of portfolios invested in T-bills and the S&P 500 index with weights as shown below. (Enter your answers as decimals rounded to 4 places. Leave no cells blank - be certain to enter "0" wherever required.) WBills Expected Return Windex 1.0 Variance 0.0441 Example 0.0 0.1200 0.2 0.8 0.1600 0.4 0.6 0.4 0.6 0.8 0.2 0.0 1.0

Step by Step Solution

There are 3 Steps involved in it

Step: 1

blur-text-image

Get Instant Access to Expert-Tailored Solutions

See step-by-step solutions with expert insights and AI powered tools for academic success

Step: 2

blur-text-image

Step: 3

blur-text-image

Ace Your Homework with AI

Get the answers you need in no time with our AI-driven, step-by-step assistance

Get Started

Recommended Textbook for

Mergers, Acquisitions and Other Restructuring Activities

Authors: Donald DePamphilis

8th edition

9780128024539, 128013907, 978-0128013908

More Books

Students also viewed these Finance questions