Answered step by step
Verified Expert Solution
Question
1 Approved Answer
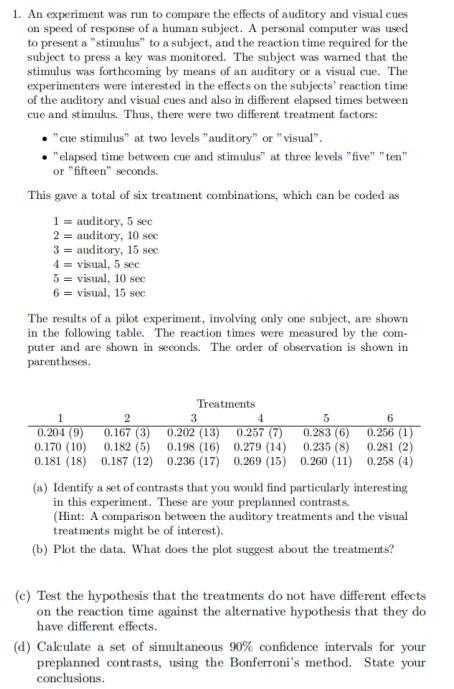
1. An experiment was run to compare the effects of auditory and visual cues on speed of response of a human subject. A personal

1. An experiment was run to compare the effects of auditory and visual cues on speed of response of a human subject. A personal computer was used to present a "stimulus" to a subject, and the reaction time required for the subject to press a key was monitored. The subject was warned that the stimulus was forthcoming by means of an auditory or a visual cue. The experimenters were interested in the effects on the subjects' reaction time of the auditory and visual cues and also in different elapsed times between cue and stimulus. Thus, there were two different treatment factors: "cue stimulus" at two levels "auditory" or "visual". "elapsed time between cue and stimulus" at three levels "five" "ten" or "fifteen" seconds. This gave a total of six treatment combinations, which can be coded as 1 = auditory, 5 sec 2 auditory, 10 sec 3 auditory, 15 sec 4= visual, 5 sec 5 = visual, 10 sec 6 = visual, 15 sec The results of a pilot experiment, involving only one subject, are shown in the following table. The reaction times were measured by the com- puter and are shown in seconds. The order of observation is shown in parentheses. 1 0.204 (9) 0.170 (10) 0.181 (18) 2 0.167 (3) 0.182 (5) 0.187 (12) Treatments 3 0.202 (13) 0.198 (16) 0.236 (17) 4 0.257 (7) 0.279 (14) 0.269 (15) 5 0.283 (6) 0.235 (8) 0.260 (11) 6 0.256 (1) 0.281 (2) 0.258 (4) (a) Identify a set of contrasts that you would find particularly interesting in this experiment. These are your preplanned contrasts. (Hint: A comparison between the auditory treatments and the visual treatments might be of interest). (b) Plot the data. What does the plot suggest about the treatments? (c) Test the hypothesis that the treatments do not have different effects on the reaction time against the alternative hypothesis that they do have different effects. (d) Calculate a set of simultaneous 90% confidence intervals for your preplanned contrasts, using the Bonferroni's method. State your conclusions.
Step by Step Solution
★★★★★
3.39 Rating (158 Votes )
There are 3 Steps involved in it
Step: 1
a A set of contrasts I would find particularly interesting in this experiment are 1 Compare the mean ...
Get Instant Access to Expert-Tailored Solutions
See step-by-step solutions with expert insights and AI powered tools for academic success
Step: 2

Step: 3

Ace Your Homework with AI
Get the answers you need in no time with our AI-driven, step-by-step assistance
Get Started


