Answered step by step
Verified Expert Solution
Link Copied!

Question

1 Approved Answer

The figure below is best described as showing: 26-Feb-2015 3% 2% 1% 0% 31 3y by 10y 304 Copyright 2015 Yahoo! Inc. http://finance.yahoo.com | The
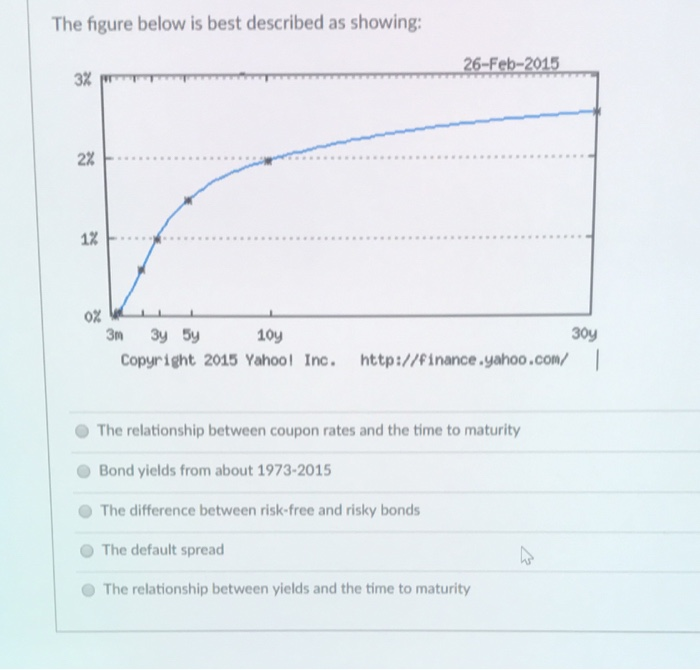
image text in transcribed
The figure below is best described as showing: 26-Feb-2015 3% 2% 1% 0% 31 3y by 10y 304 Copyright 2015 Yahoo! Inc. http://finance.yahoo.com | The relationship between coupon rates and the time to maturity Bond yields from about 1973-2015 The difference between risk-free and risky bonds The default spread The relationship between yields and the time to maturity

Step by Step Solution

There are 3 Steps involved in it

Step: 1

blur-text-image

Get Instant Access to Expert-Tailored Solutions

See step-by-step solutions with expert insights and AI powered tools for academic success

Step: 2

blur-text-image_2

Step: 3

blur-text-image_3

Ace Your Homework with AI

Get the answers you need in no time with our AI-driven, step-by-step assistance

Get Started

Recommended Textbook for

I Love My Awesome Auditor

Authors: Lovely Hearts Publishing

1st Edition

1794298169, 978-1794298163

More Books

Students also viewed these Accounting questions

Question

aco m aka 20130 frea = 5KHz aco m aka 20130 frea = 5KHz

Answered: 1 week ago

Question

24. How do the different types of firewalls work?

Answered: 1 week ago

Question

What is the best conclusion for Xbar Chart? UCL A X B C B A LCL

Answered: 1 week ago