Answered step by step
Verified Expert Solution
Question
1 Approved Answer
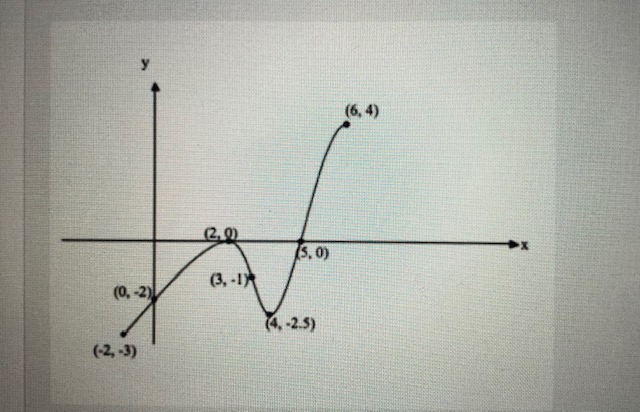
The figure below shows the graph of f , the derivative of the function f, on the closed interval from x = 2 to x
- The figure below shows the graph of f , the derivative of the function f, on the closed interval from x = 2 to x = 6. The graph of the derivative has horizontal tangent lines at x = 2 and x = 4. Find the x-value where f attains its absolute maximum value on the closed interval from x = 2 to x=6. Justify your answer.
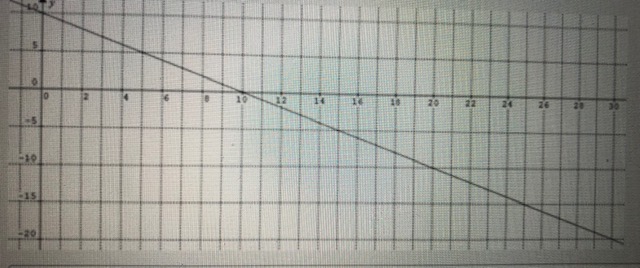
2.. A car travels along a straight road for 30 seconds starting at time t = 0. Its acceleration in ft/sec2is given by the linear graph below for the time interval [0, 30]. At t = 0, the velocity of the car is 0 and its position is 10. What is the position of the car when t = 20? You must show your work answer to 3 decimal places. Include units in your answer.


Step by Step Solution
There are 3 Steps involved in it
Step: 1

Get Instant Access to Expert-Tailored Solutions
See step-by-step solutions with expert insights and AI powered tools for academic success
Step: 2

Step: 3

Ace Your Homework with AI
Get the answers you need in no time with our AI-driven, step-by-step assistance
Get Started


