Answered step by step
Verified Expert Solution
Question
1 Approved Answer
The figure on the below depicts the labor market initially in equilibrium with employment at 100 million jobs and a wage of $10. The

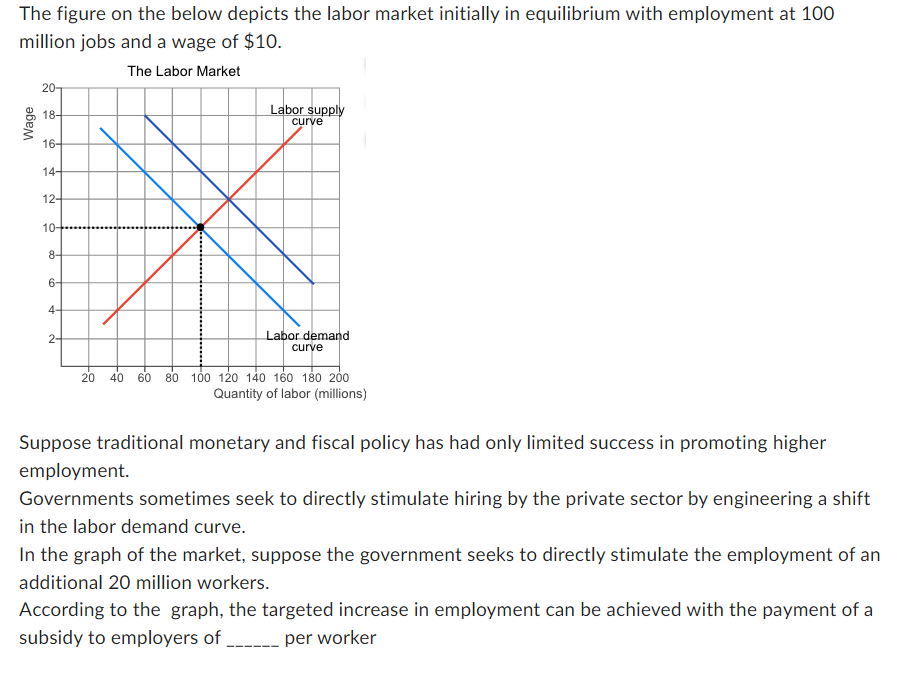
The figure on the below depicts the labor market initially in equilibrium with employment at 100 million jobs and a wage of $10. The Labor Market Wage 20- 18- 16- 14- 12- 10- 8- 6- 4- 2- Labor supply curve Labor demand curve 20 40 60 80 100 120 140 160 180 200 Quantity of labor (millions) Suppose traditional monetary and fiscal policy has had only limited success in promoting higher employment. Governments sometimes seek to directly stimulate hiring by the private sector by engineering a shift in the labor demand curve. In the graph of the market, suppose the government seeks to directly stimulate the employment of an additional 20 million workers. According to the graph, the targeted increase in employment can be achieved with the payment of a subsidy to employers of ____________ per worker
Step by Step Solution
There are 3 Steps involved in it
Step: 1
To achieve the targeted increase in employment of an additional 20 million workers the government ca...
Get Instant Access to Expert-Tailored Solutions
See step-by-step solutions with expert insights and AI powered tools for academic success
Step: 2

Step: 3

Ace Your Homework with AI
Get the answers you need in no time with our AI-driven, step-by-step assistance
Get Started


