

Question
The figure on the right shows the graphs of the cost and revenue functions for a company that manufactures and sells small radios More than
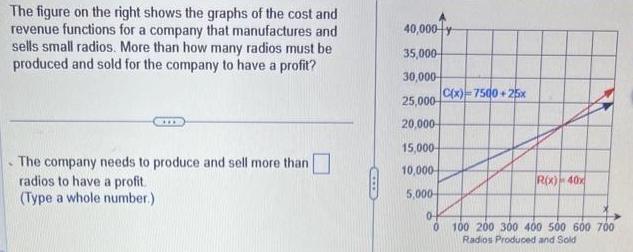

The figure on the right shows the graphs of the cost and revenue functions for a company that manufactures and sells small radios More than how many radios must be produced and sold for the company to have a profit The company needs to produce and sell more than radios to have a profit Type a whole number 40 000 y 35 000 30 000 25 000 20 000 15 000 10 000 5 000 0 0 C x 7500 25x R x 40x 100 200 300 400 500 600 700 Radios Produced and Sold
Step by Step Solution
There are 3 Steps involved in it
Step: 1

Get Instant Access to Expert-Tailored Solutions
See step-by-step solutions with expert insights and AI powered tools for academic success
Step: 2

Step: 3
Ace Your Homework with AI
Get the answers you need in no time with our AI-driven, step-by-step assistance
Get Started
Understanding Real Analysis
Authors: Paul Zorn
2nd Edition
1315315076, 9781315315072