

Answered step by step
Verified Expert Solution
Question
1 Approved Answer
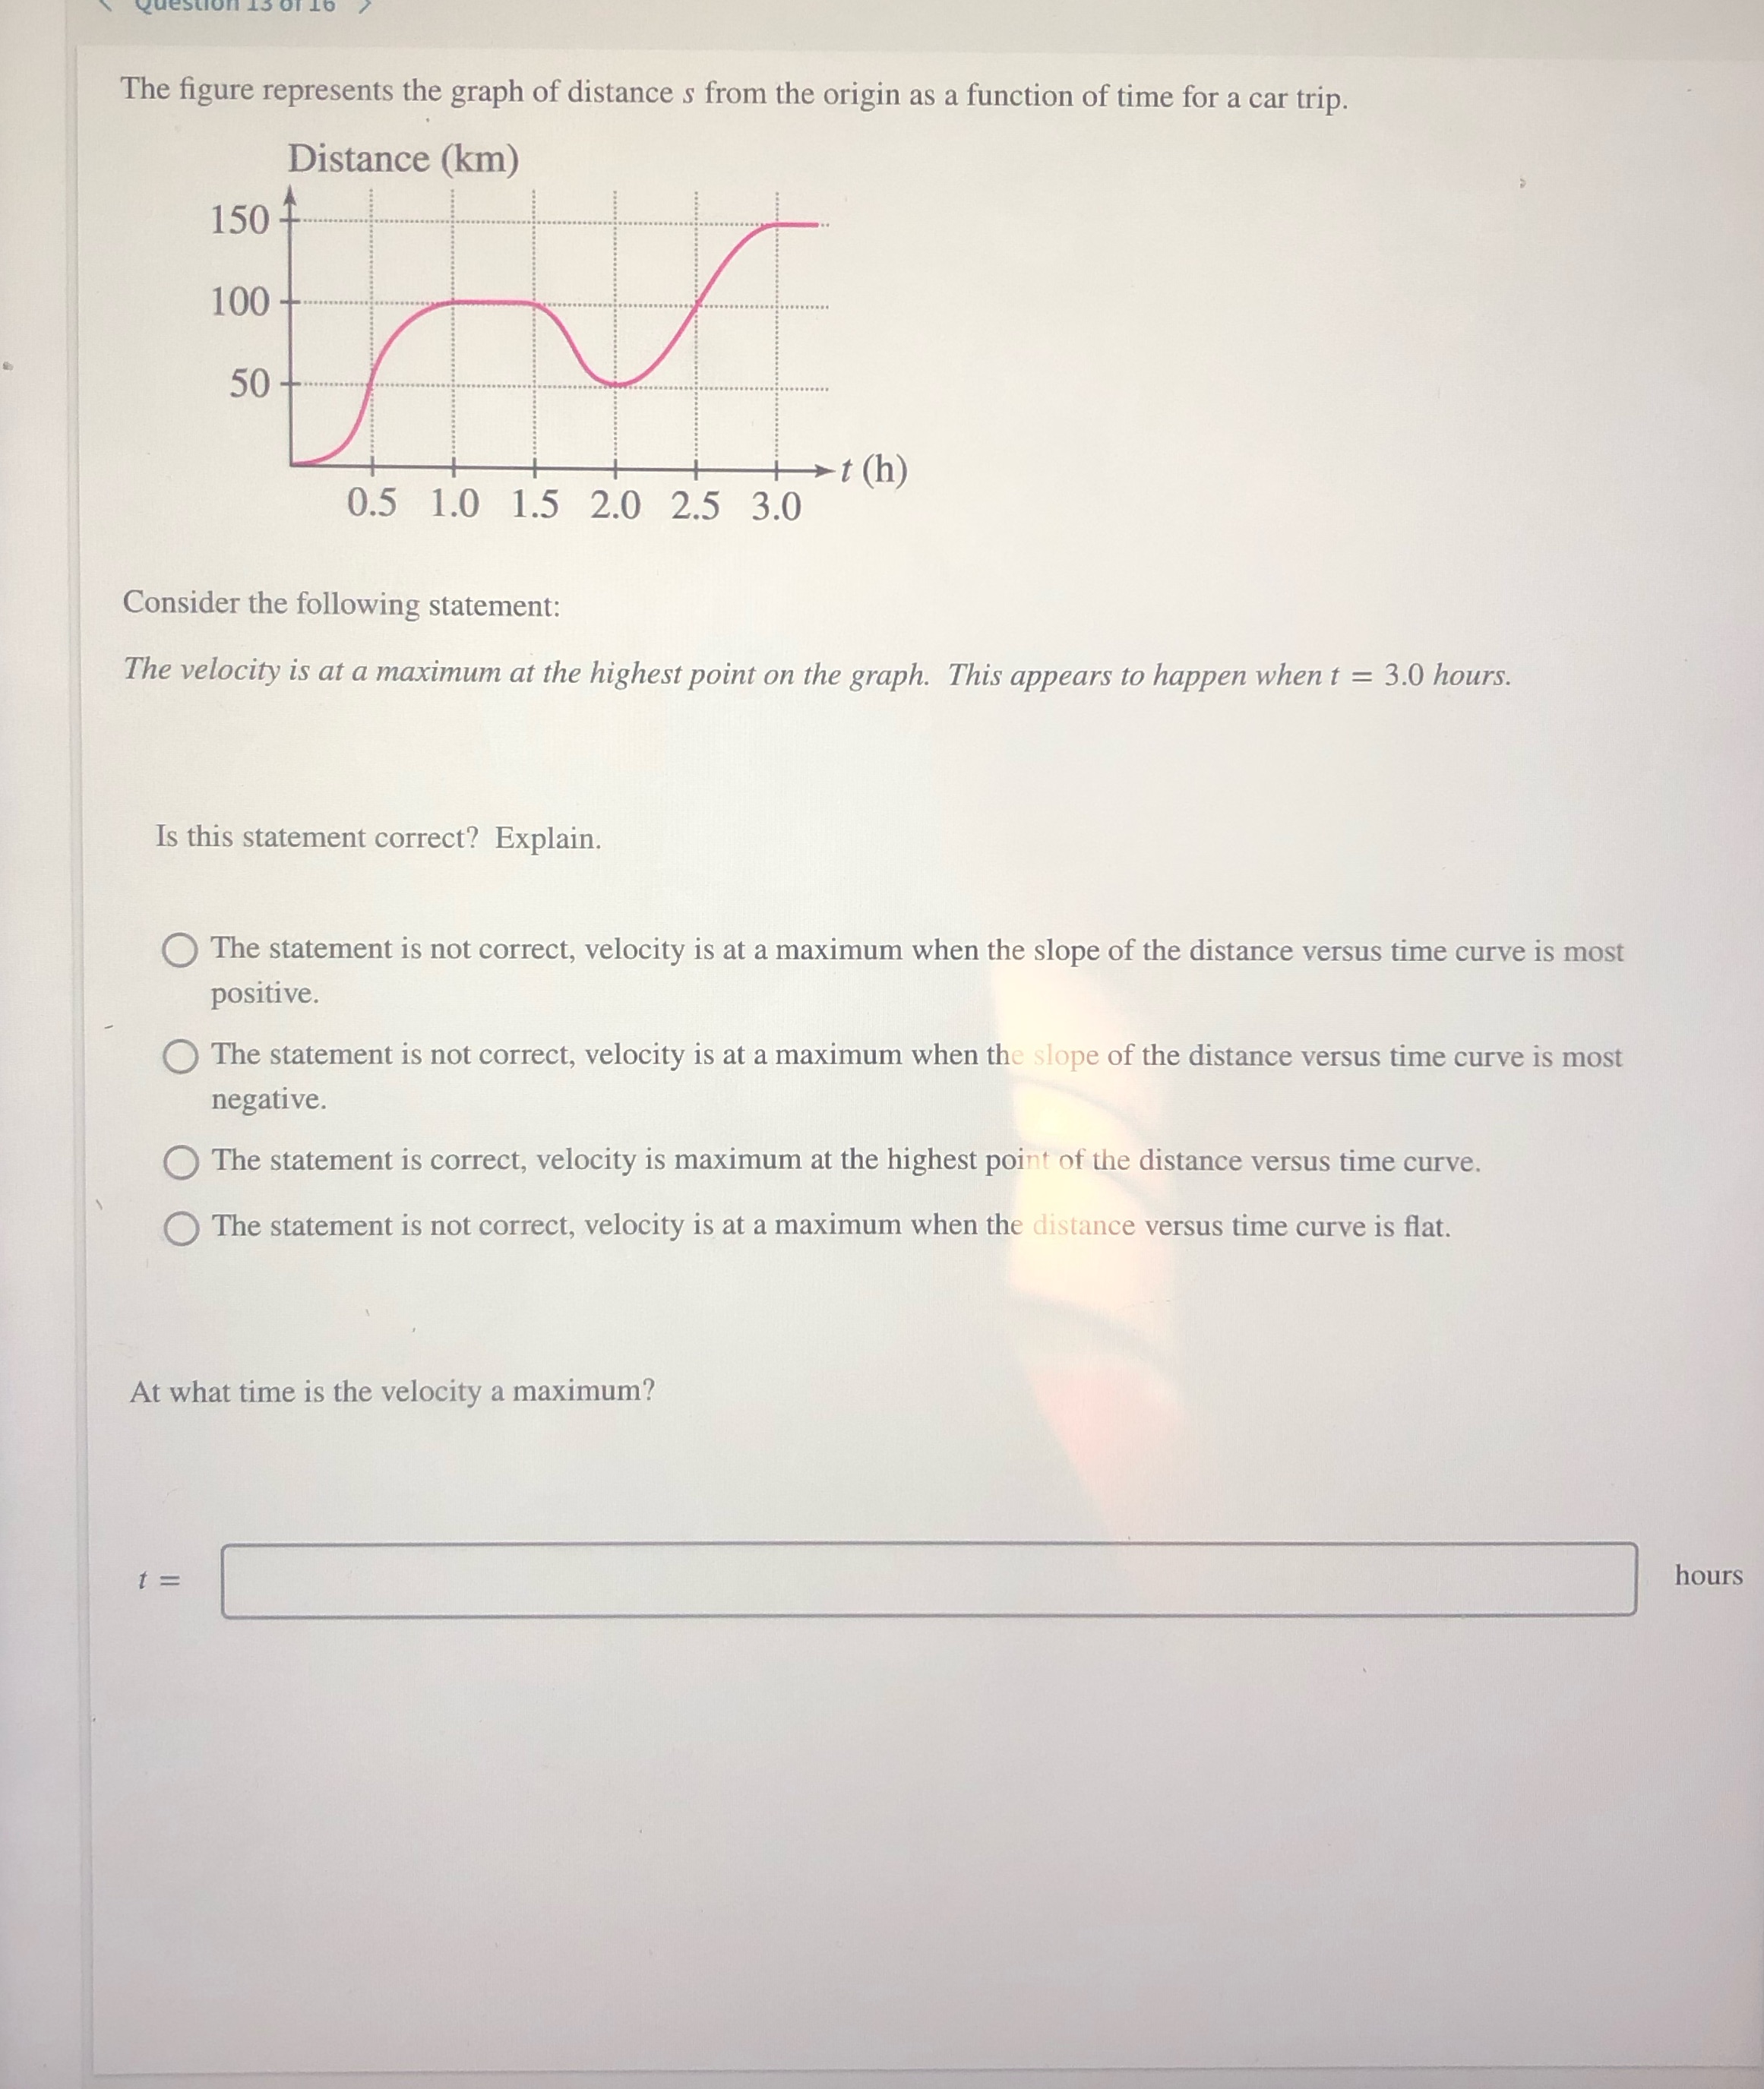
The figure represents the graph of distance s from the origin as a function of time for a car trip. 150 4 100 50 0.5
Step by Step Solution
There are 3 Steps involved in it
Step: 1

Get Instant Access to Expert-Tailored Solutions
See step-by-step solutions with expert insights and AI powered tools for academic success
Step: 2

Step: 3
Ace Your Homework with AI
Get the answers you need in no time with our AI-driven, step-by-step assistance
Get Started
Algebra A Combined Approach (Subscription)
Authors: Elayn Martin Gay
5th Edition
013417920X, 9780134179209