The figure shown below is an activity diagram that shows, at the fork above Log Out, the location where different activities can be introduced for
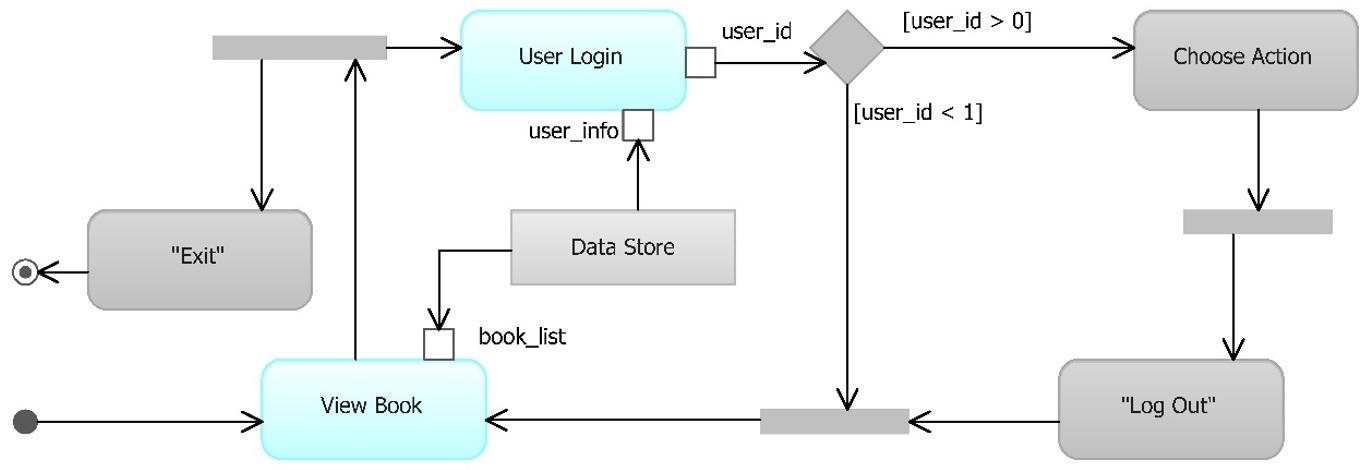
The figure shown below is an activity diagram that shows, at the fork above Log Out, the location where different activities can be introduced for a user of the online bookstore system after successfully signing in. In the diagram, the events in light blue color refer to other use cases, for each of which a separate activity diagram provides further details. For example, the flow of events for Use Login use case is presented in the figure on Slide 15 of B3.UseCaseDiagrams.pdf. Update the provided diagram  to create, with a software tool, an activity diagram that includes the flow of events for the Terminate Order use cases as described in Assignment 1.
Step by Step Solution
There are 3 Steps involved in it
Step: 1

See step-by-step solutions with expert insights and AI powered tools for academic success
Step: 2

Step: 3

Ace Your Homework with AI
Get the answers you need in no time with our AI-driven, step-by-step assistance
Get Started


