

Answered step by step
Verified Expert Solution
Question
1 Approved Answer
The figures below show implied discount factors calculated from experiments with different time horizons. 1.0 1.0 0.8 0,8 0.6 0.6 imputed discount factor imputed discount
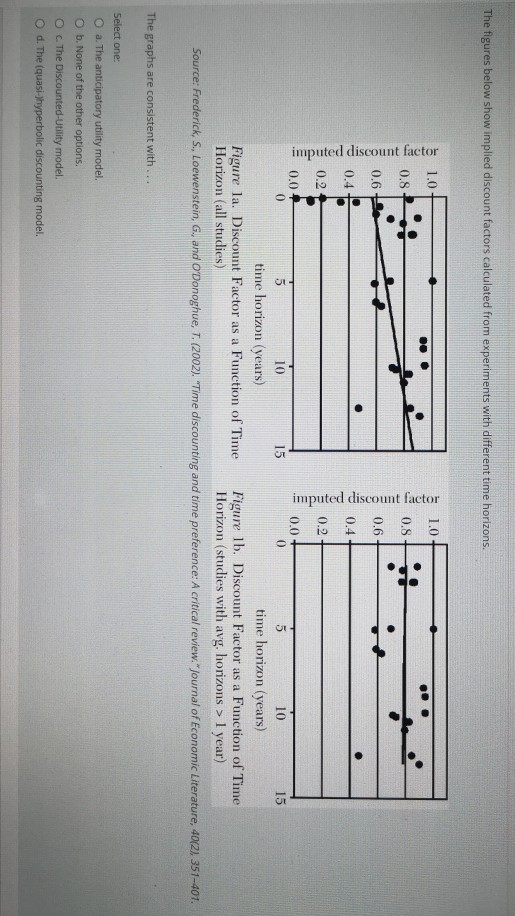
The figures below show implied discount factors calculated from experiments with different time horizons. 1.0 1.0 0.8 0,8 0.6 0.6 imputed discount factor imputed discount factor . 0.4 0.4 0.2 0.2 0.0 0.0 0 5 10 15 0 10 15 time horizon (years) time horizon (years) Figure la. Discount Factor as a Function of Time Figure 1b. Discount Factor as a Function of Time Horizon (all studies) Horizon (studies with avg, horizons > 1 year) Source: Frederick, S., Loewenstein, G, and O'Donoghue, T. (2002). "Time discounting and time preference: A critical review. Journal of Economic Literature, 40(2), 351-401. The graphs are consistent with ... Select one O a. The anticipatory utility model. O b. None of the other options. O c. The Discounted-Utility model. O d. The (quasi-hyperbolic discounting model
Step by Step Solution
There are 3 Steps involved in it
Step: 1

Get Instant Access to Expert-Tailored Solutions
See step-by-step solutions with expert insights and AI powered tools for academic success
Step: 2

Step: 3
Ace Your Homework with AI
Get the answers you need in no time with our AI-driven, step-by-step assistance
Get Started
Entrepreneurial Finance
Authors: Philip J. Adelman; Alan M. Marks
6th edition
9780133099096, 133140512, 133099091, 978-0133140514