Question
The file ApplianceShipments.csv contains the series of quarterly shipments (in millions of dollars) of US household appliances between 1985 and 1989. Quarter Shipments Q1-1985 4009
The file ApplianceShipments.csv contains the series of quarterly shipments (in millions of dollars) of US household appliances between 1985 and 1989.
| Quarter | Shipments |
| Q1-1985 | 4009 |
| Q2-1985 | 4321 |
| Q3-1985 | 4224 |
| Q4-1985 | 3944 |
| Q1-1986 | 4123 |
| Q2-1986 | 4522 |
| Q3-1986 | 4657 |
| Q4-1986 | 4030 |
| Q1-1987 | 4493 |
| Q2-1987 | 4806 |
| Q3-1987 | 4551 |
| Q4-1987 | 4485 |
| Q1-1988 | 4595 |
| Q2-1988 | 4799 |
| Q3-1988 | 4417 |
| Q4-1988 | 4258 |
| Q1-1989 | 4245 |
| Q2-1989 | 4900 |
| Q3-1989 | 4585 |
| Q4-1989 | 4533 |
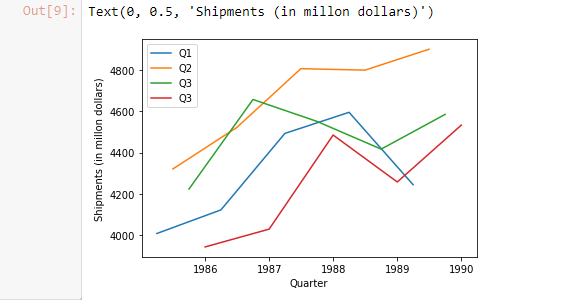
Using Python, create one chart with four separate lines, one line for each of Q1, Q2, Q3, and Q4. In Python, this can be achieved by adding columns for quarter and year. Then group the data frame by quarter and then plot shipment versus year for each quarter as a separate series on a line graph. Zoom in to the range of 35005000 on the y-axis. Does there appear to be a difference between quarters?
# Create separate time series for each quarter # Line 1 Pandas Series Q1 = shipments_df.iloc[[0, 4, 8, 12, 16], :] Q1_ts = pd.Series(Q1.Shipments.values, index=Q1.Date)
#Line 2, 3, 4 Pandas Series # MISSING: 6 lines of code needed. # Hint: Copy the above code 3 more times and change the quaters from q1 to the appropriate quarter
#Plot each of the 4 Pandas Series from above #Plot 1 plt.plot(Q1_ts, data=Q1_ts, label='Q1') plt.legend()
# Plots 2, 3, 4 # MISSING: 6 lines of code needed. # Hint: Copy the above code 3 more times and change the quaters from q1 to the appropriate quarter
#Add lables to the x and y axis # MISSING: 2 lines of code needed. "Using MATPLOTLIB"
output:

Step by Step Solution
There are 3 Steps involved in it
Step: 1

Get Instant Access to Expert-Tailored Solutions
See step-by-step solutions with expert insights and AI powered tools for academic success
Step: 2

Step: 3

Ace Your Homework with AI
Get the answers you need in no time with our AI-driven, step-by-step assistance
Get Started


