

Question
The file ApplianceShipments.csv contains the series of quarterly shipments (in millions of dollars) of US household appliances between 1985 and 1989. Quarter Shipments Q1-1985 4009
The file ApplianceShipments.csv contains the series of quarterly shipments (in millions of dollars) of US household appliances between 1985 and 1989.
| Quarter | Shipments |
| Q1-1985 | 4009 |
| Q2-1985 | 4321 |
| Q3-1985 | 4224 |
| Q4-1985 | 3944 |
| Q1-1986 | 4123 |
| Q2-1986 | 4522 |
| Q3-1986 | 4657 |
| Q4-1986 | 4030 |
| Q1-1987 | 4493 |
| Q2-1987 | 4806 |
| Q3-1987 | 4551 |
| Q4-1987 | 4485 |
| Q1-1988 | 4595 |
| Q2-1988 | 4799 |
| Q3-1988 | 4417 |
| Q4-1988 | 4258 |
| Q1-1989 | 4245 |
| Q2-1989 | 4900 |
| Q3-1989 | 4585 |
| Q4-1989 | 4533 |
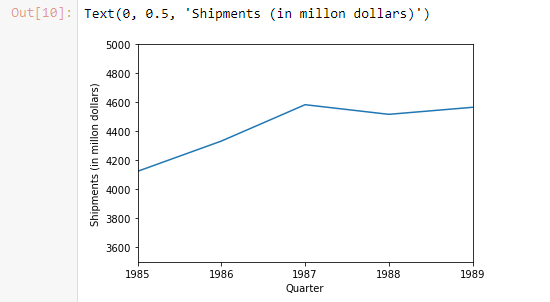
Using Python, create a line graph of the series at a yearly aggregated level (i.e., the total shipments in each year).
# 1. Create a line plot (time series) of the data with yearly aggregated series # Hint: add groupby() function to dataframe before plotting # MISSING: 2 lines of code needed. # Hint: Do not need the .loc from the example due to not filting rows here
#Add lables to the x and y axis # MISSING: 2 lines of code needed.
Output:
Step by Step Solution
There are 3 Steps involved in it
Step: 1

Get Instant Access to Expert-Tailored Solutions
See step-by-step solutions with expert insights and AI powered tools for academic success
Step: 2

Step: 3
Ace Your Homework with AI
Get the answers you need in no time with our AI-driven, step-by-step assistance
Get Started
Directions In Databases 12th British National Conference On Databases Bncod 12 Guildford United Kingdom July 6 8 1994 Proceedings Lncs 826
Authors: David S. Bowers
1994th Edition
3540582355, 978-3540582359