Answered step by step
Verified Expert Solution
Link Copied!

Question

1 Approved Answer

The file 'Exam 1Exam2.csv' contains scores on the first two exams for students enrolled in a statistics course. Use software to analyze this data. Let
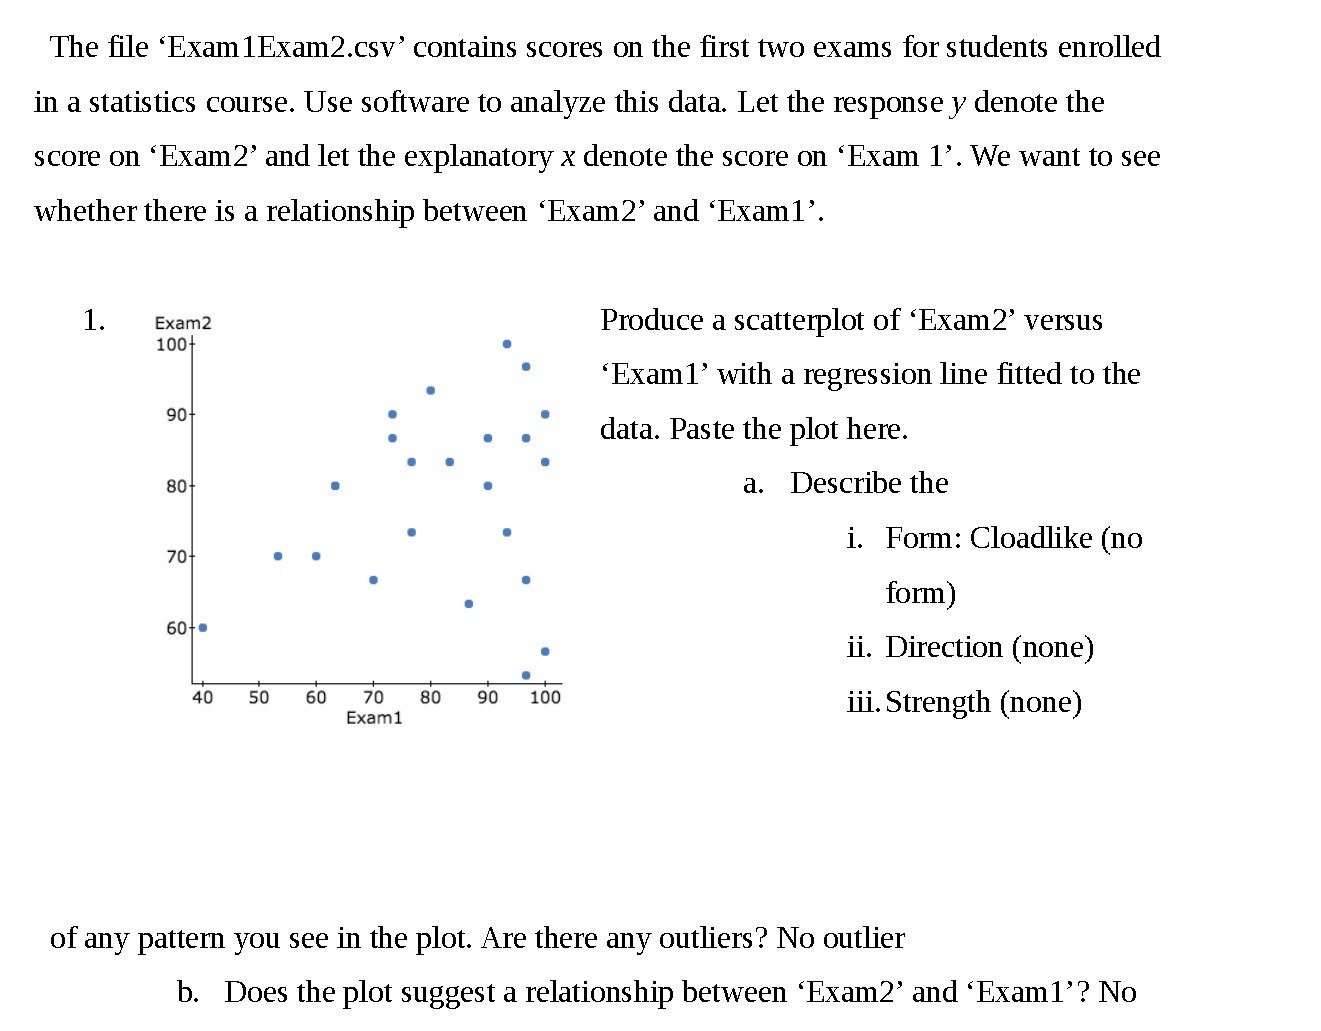
image text in transcribed
The file 'Exam 1Exam2.csv' contains scores on the first two exams for students enrolled in a statistics course. Use software to analyze this data. Let the response y denote the score on 'Exam 2' and let the explanatory x denote the score on 'Exam 1'. We want to see whether there is a relationship between 'Exam2' and 'Exam1'. 1. Exam2 100 Produce a scatterplot of 'Exam2' versus 'Exam1' with a regression line fitted to the 90- data. Paste the plot here. 80 a. Describe the 70- i. Form: Cloadlike (no form) 60-. ii. Direction (none) 40 50 60 70 80 90 100 Exam1 iii. Strength (none) of any pattern you see in the plot. Are there any outliers? No outlier b. Does the plot suggest a relationship between 'Exam2' and 'Exam1'? No

Step by Step Solution

There are 3 Steps involved in it

Step: 1

blur-text-image

Get Instant Access to Expert-Tailored Solutions

See step-by-step solutions with expert insights and AI powered tools for academic success

Step: 2

blur-text-image

Step: 3

blur-text-image

Ace Your Homework with AI

Get the answers you need in no time with our AI-driven, step-by-step assistance

Get Started

Recommended Textbook for

An Introduction to the Mathematics of financial Derivatives

Authors: Salih N. Neftci

2nd Edition

978-0125153928, 9780080478647, 125153929, 978-0123846822

More Books

Students also viewed these Mathematics questions

Question

Write a short notes on Accounting costs and economic costs.

Answered: 1 week ago