

Question
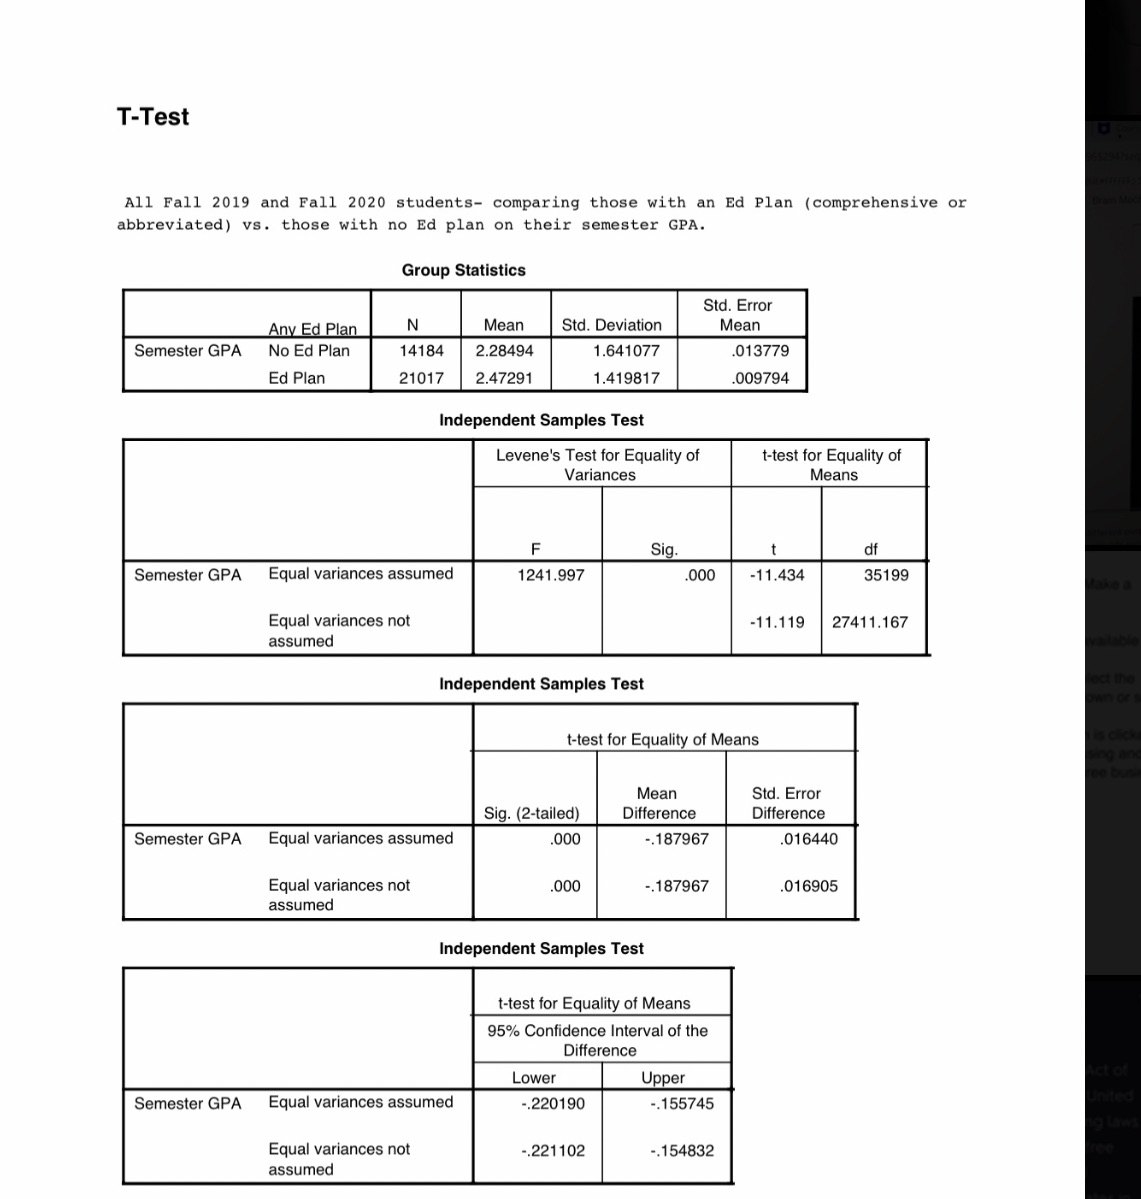
The file has two sets of output. The first box of output has the general statistics - the mean, N, and standard deviation. The second
The file has two sets of output. The first box of output has the general statistics - the mean, N, and standard deviation. The second box has the t-test results - start with the t...Write out the research hypothesis (name the variables and say they are related) and the null hypothesis (name the variables and say that they are not related). Be sure to state the semesters of data. (remember this data is for all students, while the data for your data project is for first year students only)Figure the df (total N-2) and, using an alpha of 0.05, find the cut off value of t (Appendix Table A-2, pg 675).Make a decision about the null hypothesis - accept or reject.Interpret your findings - is there a relationship between these two variables? If so, what is the nature of that relationship? (Refer to the means...) Speculate on why these findings might be as they are.
Step by Step Solution
There are 3 Steps involved in it
Step: 1

Get Instant Access to Expert-Tailored Solutions
See step-by-step solutions with expert insights and AI powered tools for academic success
Step: 2

Step: 3
Ace Your Homework with AI
Get the answers you need in no time with our AI-driven, step-by-step assistance
Get Started
Calculus Early Transcendentals, Multivariable
Authors: Michael Sullivan, Kathleen Miranda
2nd Edition
131924288X, 9781319242886