

Answered step by step
Verified Expert Solution
Question
1 Approved Answer
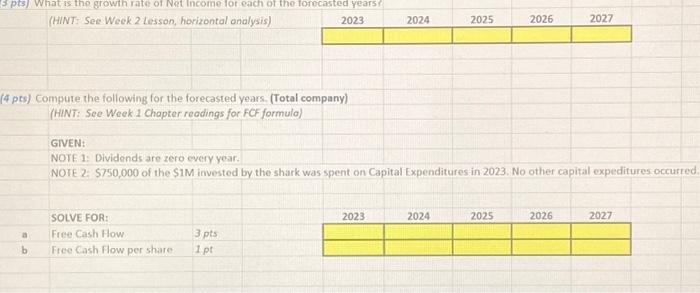
The financial statements below show Actual data (in white) and Forecasted data (highlighted in blue). Use the data below to complete your Milestone 3 Metrics
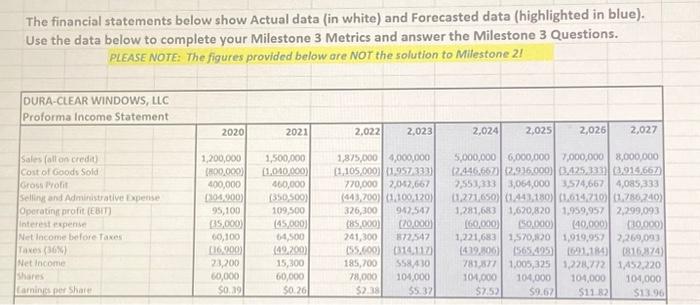
The financial statements below show Actual data (in white) and Forecasted data (highlighted in blue). Use the data below to complete your Milestone 3 Metrics and answer the Milestone 3 Questions. PLEASE NOTE: The figures provided below are NOT the solution to Milestone 2! DURA-CLEAR WINDOWS, LLC Proforma Income Statement Sales (all on credit) Cost of Goods Sold Gross Profit Selling and Administrative Expense Operating profit (EBIT) Interest expense Net Income before Taxes Taxes (36%) Net Income Shares Earnings per Share 2020 2021 1,200,000 1,500,000 (800,000) (1,040,000) 400,000 460,000 (304,900) (350,500) 109,500 (45,000) 64,500 (49,200) 15,300 60,000 $0.26 95,100 (35,000) 60,100 (36,900) 23,200 60,000 $0.39 2,022 2,023 1,875,000 4,000,000 (1,105,000) (1,957,333) 770,000 2,042,667 (443,700) (1,100,120) 326,300 942,547 (85,000) (70,000) 241,300 872,547 (55,600) (314,117) 185,700 558,430 78,000 104,000 $2.38 $5.37 2,024 2,025 2,026 2,027 5,000,000 6,000,000 7,000,000 8,000,000 (2.446,667) (2,936,000) (3,425,333) (3,914,667) 2,553,333 3,064,000 3,574,667 4,085,333 (1,271,650) (1,443,180) (1,614,710) (1,786,240) 1,281,683 1,620,820 1,959,957 2,299,093 (60,000) (50,000) (40,000) (30,000) 1,221,683 1,570,820 1,919,957 2,269,093 (439,806) (565,495) (691,184) (816,874) 781,877 1,005,325 1,228,772 1,452,220 104,000 104,000 104,000 104,000 $7.52 $9.67 $11.82 $13.96
Step by Step Solution
There are 3 Steps involved in it
Step: 1

Get Instant Access to Expert-Tailored Solutions
See step-by-step solutions with expert insights and AI powered tools for academic success
Step: 2

Step: 3
Ace Your Homework with AI
Get the answers you need in no time with our AI-driven, step-by-step assistance
Get Started
Fraud Examination
Authors: W. Steve Albrecht, Conan C. Albrecht, Chad O. Albrecht, Mark F. Zimbelman
3rd edition
324560842, 978-0324560848