Question
The financial statements for Abbott Laboratories for 2020 are provided separately and located in the below attachment . Compute the following (3 points per sub-question):
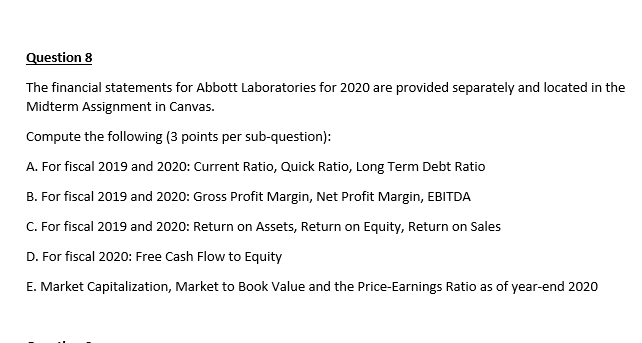 The financial statements for Abbott Laboratories for 2020 are provided separately and located in the below attachment
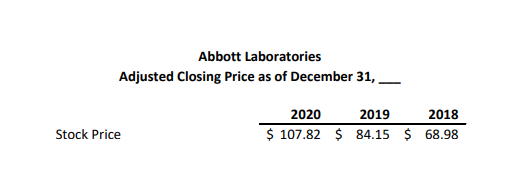
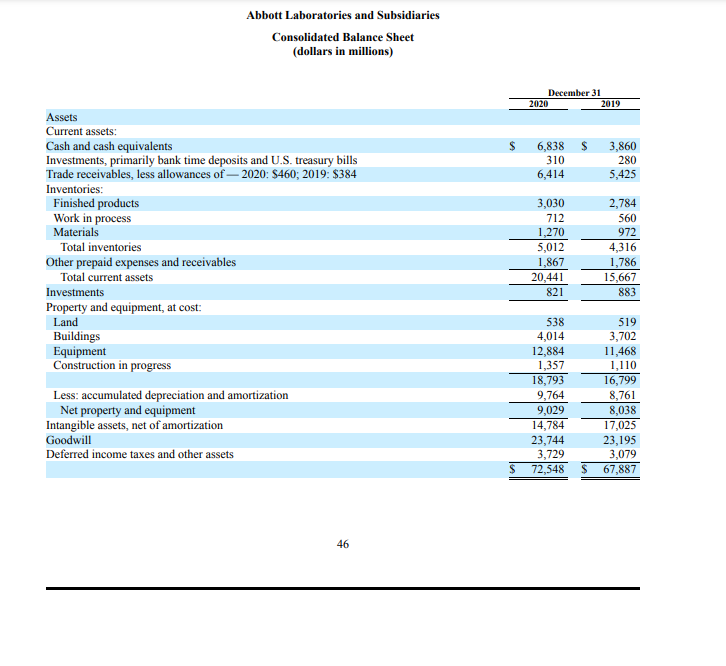
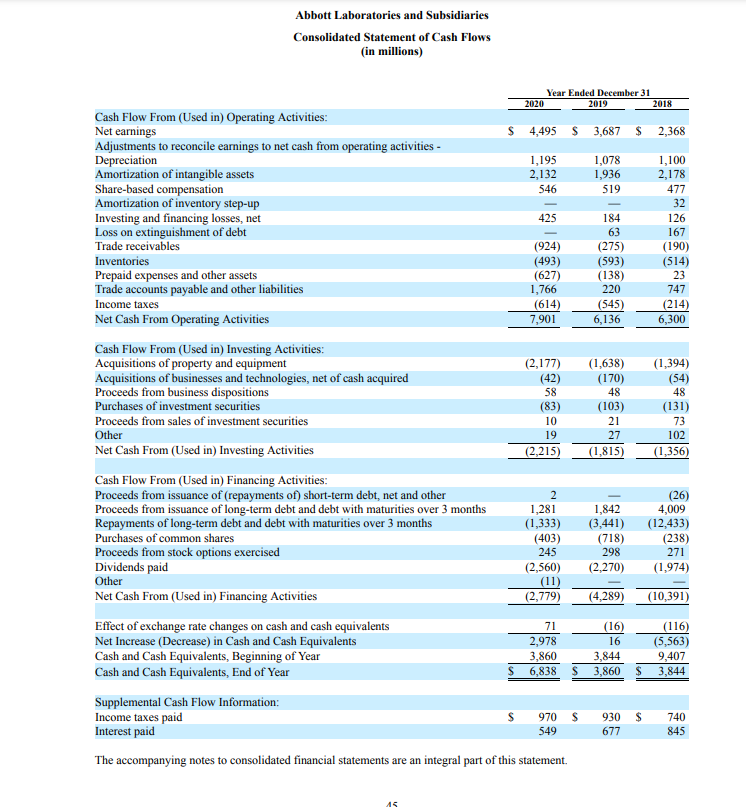
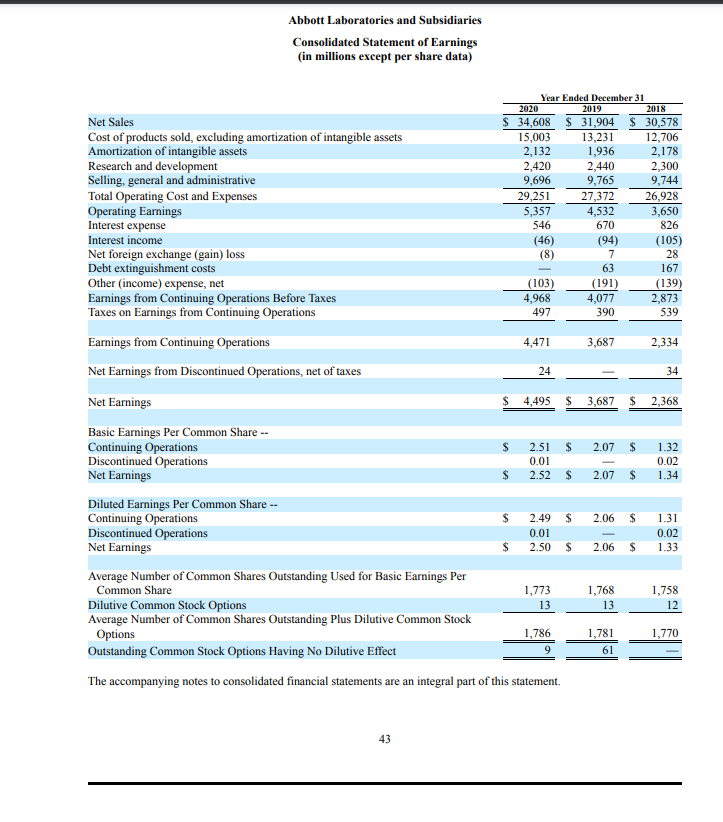 . Compute the following (3 points per sub-question): A. For fiscal 2019 and 2020: Current Ratio, Quick Ratio, Long Term Debt Ratio B. For fiscal 2019 and 2020: Gross Profit Margin, Net Profit Margin, EBITDA C. For fiscal 2019 and 2020: Return on Assets, Return on Equity, Return on Sales D. For fiscal 2020: Free Cash Flow to Equity E. Market Capitalization, Market to Book Value and the Price-Earnings Ratio as of year-end 2020
Please answer ALL parts in detail. Will give good rating!!
Question 8 The financial statements for Abbott Laboratories for 2020 are provided separately and located in the Midterm Assignment in Canvas. Compute the following (3 points per sub-question): A. For fiscal 2019 and 2020: Current Ratio, Quick Ratio, Long Term Debt Ratio B. For fiscal 2019 and 2020: Gross Profit Margin, Net Profit Margin, EBITDA C. For fiscal 2019 and 2020: Return on Assets, Return on Equity, Return on Sales D. For fiscal 2020: Free Cash Flow to Equity E. Market Capitalization, Market to Book Value and the Price Earnings Ratio as of year-end 2020 Abbott Laboratories Adjusted Closing Price as of December 31, 2020 2019 2018 $ 107.82 $ 84.15 $ 68.98 Stock Price Abbott Laboratories and Subsidiaries Consolidated Balance Sheet (dollars in millions) December 31 2020 2019 6,838 $ 310 6,414 3,860 280 5,425 Assets Current assets: Cash and cash equivalents Investments, primarily bank time deposits and U.S. treasury bills Trade receivables, less allowances of 2020: $460; 2019: $384 Inventories: Finished products Work in process Materials Total inventories Other prepaid expenses and receivables Total current assets Investments Property and equipment, at cost: Land Buildings Equipment Construction in progress Less: accumulated depreciation and amortization Net property and equipment Intangible assets, net of amortization Goodwill Deferred income taxes and other assets 3,030 712 1,270 5,012 1,867 20,441 821 2,784 560 972 4,316 1,786 15,667 883 538 4,014 12,884 1,357 18,793 9,764 9,029 14,784 23,744 3,729 72,548 519 3,702 11,468 1,110 16,799 8,761 8,038 17,025 23,195 3,079 67,887 $ 46 Abbott Laboratories and Subsidiaries Consolidated Statement of Cash Flows (in millions) Year Ended December 31 2020 2019 2018 $ 4,495 $3,687 $ 2,368 1,195 2,132 546 1,078 1,936 519 425 (924) (493) (627) 1,766 (614) 7,901 184 63 (275) (593) (138) 220 (545) 6,136 1,100 2,178 477 32 126 167 (190) (514) 23 747 (214) 6,300 Cash Flow From (Used in) Operating Activities: Net earnings Adjustments to reconcile earnings to net cash from operating activities - Depreciation Amortization of intangible assets Share-based compensation Amortization of inventory step-up Investing and financing losses, net Loss on extinguishment of debt Trade receivables Inventories Prepaid expenses and other assets Trade accounts payable and other liabilities Income taxes Net Cash From Operating Activities Cash Flow From (Used in) Investing Activities: Acquisitions of property and equipment Acquisitions of businesses and technologies, net of cash acquired Proceeds from business dispositions Purchases of investment securities Proceeds from sales of investment securities Other Net Cash From (Used in) Investing Activities Cash Flow From (Used in) Financing Activities: Proceeds from issuance of (repayments of) short-term debt, net and other Proceeds from issuance of long-term debt and debt with maturities over 3 months Repayments of long-term debt and debt with maturities over 3 months Purchases of common shares Proceeds from stock options exercised Dividends paid Other Net Cash From (Used in) Financing Activities Effect of exchange rate changes on cash and cash equivalents Net Increase (Decrease) in Cash and Cash Equivalents Cash and Cash Equivalents, Beginning of Year Cash and Cash Equivalents, End of Year (2,177) (42) 58 (83) 10 19 (2,215) (1,638) (170) 48 (103) 21 27 (1,815 (1,394) (54) 48 (131) 73 102 (1,356) 2 1,281 (1,333) (403) 245 (2,560) (11) (2,779) 1,842 (3,441) (718) 298 (2,270) (26) 4,009 (12,433) (238) 271 (1,974) (4,289) (10,391) 71 2,978 3,860 6,838 (16) 16 3,844 3,860 (116) (5,563) 9,407 3,844 S S $ $ Supplemental Cash Flow Information: Income taxes paid 970 Interest paid The accompanying notes to consolidated financial statements are an integral part of this statement. 930 677 740 845 549 45 Abbott Laboratories and Subsidiaries Consolidated Statement of Earnings (in millions except per share data) Net Sales Cost of products sold, excluding amortization of intangible assets Amortization of intangible assets Research and development Selling general and administrative Total Operating Cost and Expenses Operating Earnings Interest expense Interest income Net foreign exchange (gain) loss Debt extinguishment costs Other (income) expense, net Earnings from Continuing Operations Before Taxes Taxes on Earnings from Continuing Operations Year Ended December 31 2020 2019 2018 $ 34,608 $ 31,904 $ 30,578 15,003 13,231 12,706 2,132 1,936 2,178 2,420 2,440 2,300 9,696 9,765 9,744 29,251 27,372 26,928 5,357 4,532 3,650 546 670 826 (46) (94) (105) (8) 7 28 63 167 (103) (191) (139) 4,968 4,077 2,873 497 390 539 4,471 3,687 2,334 Earnings from Continuing Operations Net Earnings from Discontinued Operations, net of taxes 24 34 Net Earnings $ 4,495 $ 3,687 $ 2,368 $ 2.07 $ 0.01 1.32 0.02 1.34 $ A 2.07 $ $ 2.06 $ 0.01 1.31 0.02 1.33 $ 2.06 $ Basic Earnings Per Common Share -- Continuing Operations 2.51 $ Discontinued Operations Net Earnings 2.52 Diluted Earnings Per Common Share -- Continuing Operations 2.49 $ Discontinued Operations Net Earnings 2.50 $ Average Number of Common Shares Outstanding Used for Basic Earnings Per Common Share 1,773 Dilutive Common Stock Options 13 Average Number of Common Shares Outstanding Plus Dilutive Common Stock Options 1,786 Outstanding Common Stock Options Having No Dilutive Effect The accompanying notes to consolidated financial statements are an integral part of this statement. 1,768 13 1,758 12 1,770 1,781 61 9 | 43 Question 8 The financial statements for Abbott Laboratories for 2020 are provided separately and located in the Midterm Assignment in Canvas. Compute the following (3 points per sub-question): A. For fiscal 2019 and 2020: Current Ratio, Quick Ratio, Long Term Debt Ratio B. For fiscal 2019 and 2020: Gross Profit Margin, Net Profit Margin, EBITDA C. For fiscal 2019 and 2020: Return on Assets, Return on Equity, Return on Sales D. For fiscal 2020: Free Cash Flow to Equity E. Market Capitalization, Market to Book Value and the Price Earnings Ratio as of year-end 2020 Abbott Laboratories Adjusted Closing Price as of December 31, 2020 2019 2018 $ 107.82 $ 84.15 $ 68.98 Stock Price Abbott Laboratories and Subsidiaries Consolidated Balance Sheet (dollars in millions) December 31 2020 2019 6,838 $ 310 6,414 3,860 280 5,425 Assets Current assets: Cash and cash equivalents Investments, primarily bank time deposits and U.S. treasury bills Trade receivables, less allowances of 2020: $460; 2019: $384 Inventories: Finished products Work in process Materials Total inventories Other prepaid expenses and receivables Total current assets Investments Property and equipment, at cost: Land Buildings Equipment Construction in progress Less: accumulated depreciation and amortization Net property and equipment Intangible assets, net of amortization Goodwill Deferred income taxes and other assets 3,030 712 1,270 5,012 1,867 20,441 821 2,784 560 972 4,316 1,786 15,667 883 538 4,014 12,884 1,357 18,793 9,764 9,029 14,784 23,744 3,729 72,548 519 3,702 11,468 1,110 16,799 8,761 8,038 17,025 23,195 3,079 67,887 $ 46 Abbott Laboratories and Subsidiaries Consolidated Statement of Cash Flows (in millions) Year Ended December 31 2020 2019 2018 $ 4,495 $3,687 $ 2,368 1,195 2,132 546 1,078 1,936 519 425 (924) (493) (627) 1,766 (614) 7,901 184 63 (275) (593) (138) 220 (545) 6,136 1,100 2,178 477 32 126 167 (190) (514) 23 747 (214) 6,300 Cash Flow From (Used in) Operating Activities: Net earnings Adjustments to reconcile earnings to net cash from operating activities - Depreciation Amortization of intangible assets Share-based compensation Amortization of inventory step-up Investing and financing losses, net Loss on extinguishment of debt Trade receivables Inventories Prepaid expenses and other assets Trade accounts payable and other liabilities Income taxes Net Cash From Operating Activities Cash Flow From (Used in) Investing Activities: Acquisitions of property and equipment Acquisitions of businesses and technologies, net of cash acquired Proceeds from business dispositions Purchases of investment securities Proceeds from sales of investment securities Other Net Cash From (Used in) Investing Activities Cash Flow From (Used in) Financing Activities: Proceeds from issuance of (repayments of) short-term debt, net and other Proceeds from issuance of long-term debt and debt with maturities over 3 months Repayments of long-term debt and debt with maturities over 3 months Purchases of common shares Proceeds from stock options exercised Dividends paid Other Net Cash From (Used in) Financing Activities Effect of exchange rate changes on cash and cash equivalents Net Increase (Decrease) in Cash and Cash Equivalents Cash and Cash Equivalents, Beginning of Year Cash and Cash Equivalents, End of Year (2,177) (42) 58 (83) 10 19 (2,215) (1,638) (170) 48 (103) 21 27 (1,815 (1,394) (54) 48 (131) 73 102 (1,356) 2 1,281 (1,333) (403) 245 (2,560) (11) (2,779) 1,842 (3,441) (718) 298 (2,270) (26) 4,009 (12,433) (238) 271 (1,974) (4,289) (10,391) 71 2,978 3,860 6,838 (16) 16 3,844 3,860 (116) (5,563) 9,407 3,844 S S $ $ Supplemental Cash Flow Information: Income taxes paid 970 Interest paid The accompanying notes to consolidated financial statements are an integral part of this statement. 930 677 740 845 549 45 Abbott Laboratories and Subsidiaries Consolidated Statement of Earnings (in millions except per share data) Net Sales Cost of products sold, excluding amortization of intangible assets Amortization of intangible assets Research and development Selling general and administrative Total Operating Cost and Expenses Operating Earnings Interest expense Interest income Net foreign exchange (gain) loss Debt extinguishment costs Other (income) expense, net Earnings from Continuing Operations Before Taxes Taxes on Earnings from Continuing Operations Year Ended December 31 2020 2019 2018 $ 34,608 $ 31,904 $ 30,578 15,003 13,231 12,706 2,132 1,936 2,178 2,420 2,440 2,300 9,696 9,765 9,744 29,251 27,372 26,928 5,357 4,532 3,650 546 670 826 (46) (94) (105) (8) 7 28 63 167 (103) (191) (139) 4,968 4,077 2,873 497 390 539 4,471 3,687 2,334 Earnings from Continuing Operations Net Earnings from Discontinued Operations, net of taxes 24 34 Net Earnings $ 4,495 $ 3,687 $ 2,368 $ 2.07 $ 0.01 1.32 0.02 1.34 $ A 2.07 $ $ 2.06 $ 0.01 1.31 0.02 1.33 $ 2.06 $ Basic Earnings Per Common Share -- Continuing Operations 2.51 $ Discontinued Operations Net Earnings 2.52 Diluted Earnings Per Common Share -- Continuing Operations 2.49 $ Discontinued Operations Net Earnings 2.50 $ Average Number of Common Shares Outstanding Used for Basic Earnings Per Common Share 1,773 Dilutive Common Stock Options 13 Average Number of Common Shares Outstanding Plus Dilutive Common Stock Options 1,786 Outstanding Common Stock Options Having No Dilutive Effect The accompanying notes to consolidated financial statements are an integral part of this statement. 1,768 13 1,758 12 1,770 1,781 61 9 | 43Step by Step Solution
There are 3 Steps involved in it
Step: 1

Get Instant Access to Expert-Tailored Solutions
See step-by-step solutions with expert insights and AI powered tools for academic success
Step: 2

Step: 3

Ace Your Homework with AI
Get the answers you need in no time with our AI-driven, step-by-step assistance
Get Started


