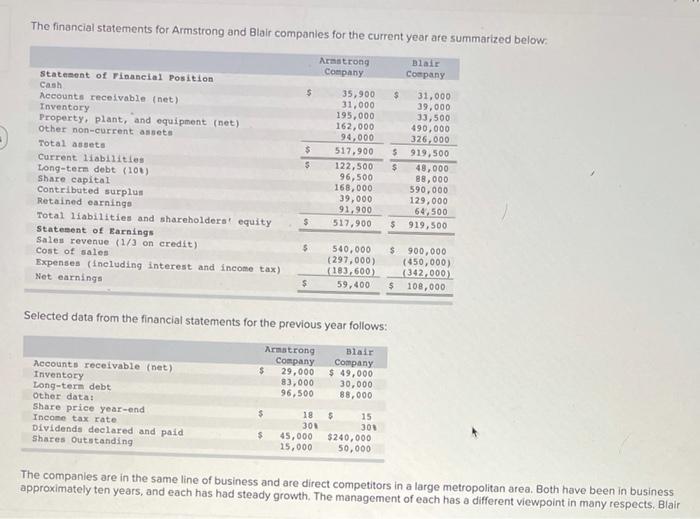
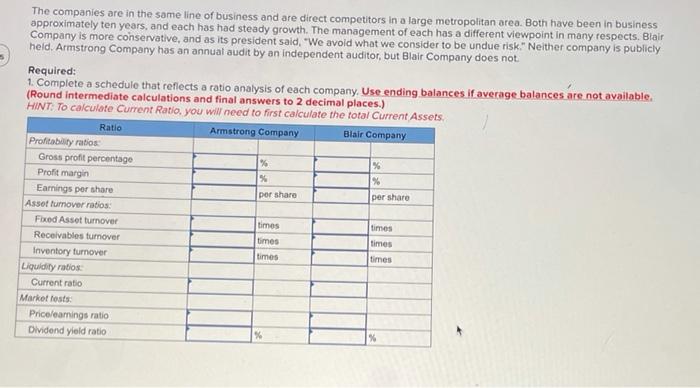
The financial statements for Armstrong and Blair companies for the current year are summarized below Armstrong Company Blair Company $ $ $ 35,900 31,000 195,000 162,000 94,000 517.900 122,500 96,500 168,000 39,000 91.900 517.900 $ $ statement of Financial Position Cash Accounts receivable (net) Inventory Property, plant, and equipment (net) Other non-current assets Total assets Current liabilities Long-term debt (101) Share capital Contributed surplus Retained earnings Total liabilities and shareholders' equity statement of Earnings Sales revenue (1/3 on credit) Cost of sales Expenses (including interest and income tax) Net earnings 31,000 39,000 33,500 490,000 326.000 919,500 49,000 88,000 590,000 129,000 64.500 919,500 5 $ $ 5 540.000 (297,000) (183.600) 59,400 $ 900,000 (450,000) (342,000) $ 108,000 $ Selected data from the financial statements for the previous year follows: Armstrong Company $ 29,000 83,000 96,500 Accounts receivable (net) Inventory Long-term debt Other data: Share price year-end Income tax rate Dividends declared and paid Shares Outstanding Blair Company $ 49,000 30,000 88,000 $ 18 301 $ 45,000 15,000 $ 15 300 $240,000 50,000 The companies are in the same line of business and are direct competitors in a large metropolitan area. Both have been in business approximately ten years, and each has had steady growth. The management of each has a different viewpoint in many respects, Blair The companies are in the same line of business and are direct competitors in a large metropolitan area. Both have been in business approximately ten years, and each has had steady growth. The management of each has a different viewpoint in many respects. Blair Company is more conservative, and as its president said. "We avoid what we consider to be undue risk" Neither company is publicly held. Armstrong company has an annual audit by an independent auditor, but Blair Company does not Required: 1. Complete a schedule that reflects a ratio analysis of each company. Use ending balances if average balances are not available. (Round intermediate calculations and final answers to 2 decimal places.) HINT: To calculate Current Ratio, you will need to first calculate the total Current Assets Ratio Armstrong Company Blair Company Profitability ratios Gross profit percentage % % Profit margin % % Earnings per share por share per share Assof turnover ratios Fixed Asset turnover times times Receivables turnover times times Inventory turnover times times Liquidity ratios Current ratio Market tests Pricelearnings ratio Dividend yield ratio %