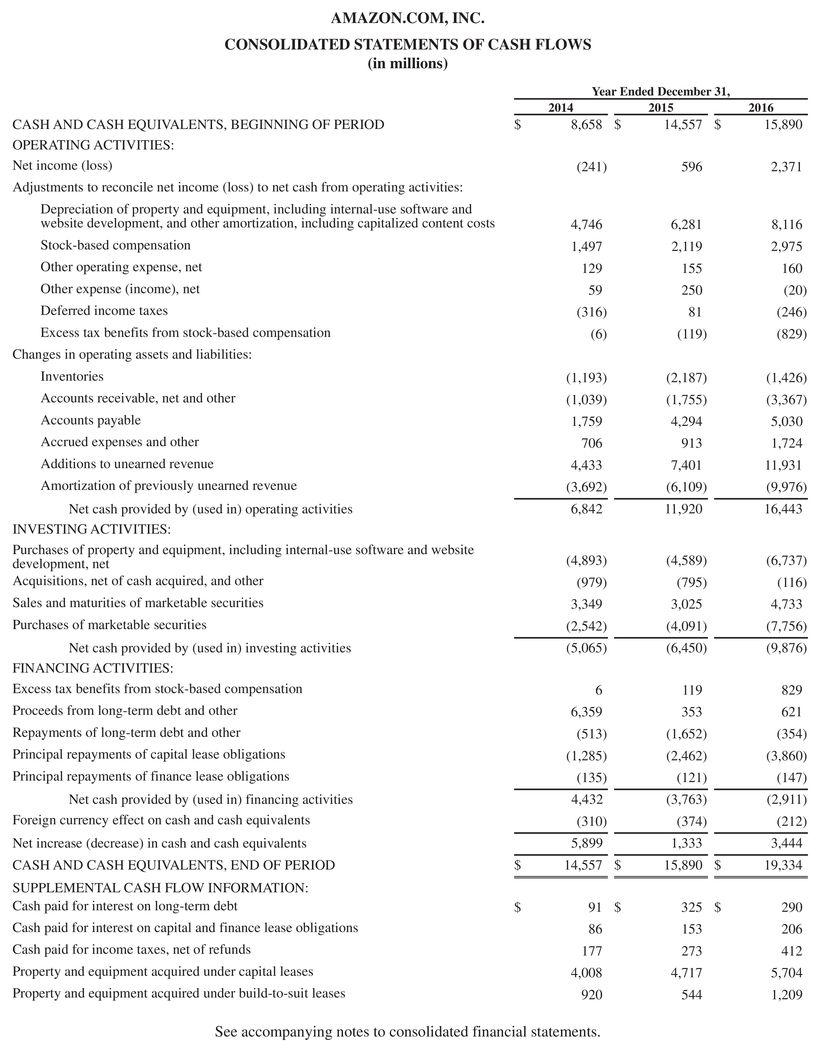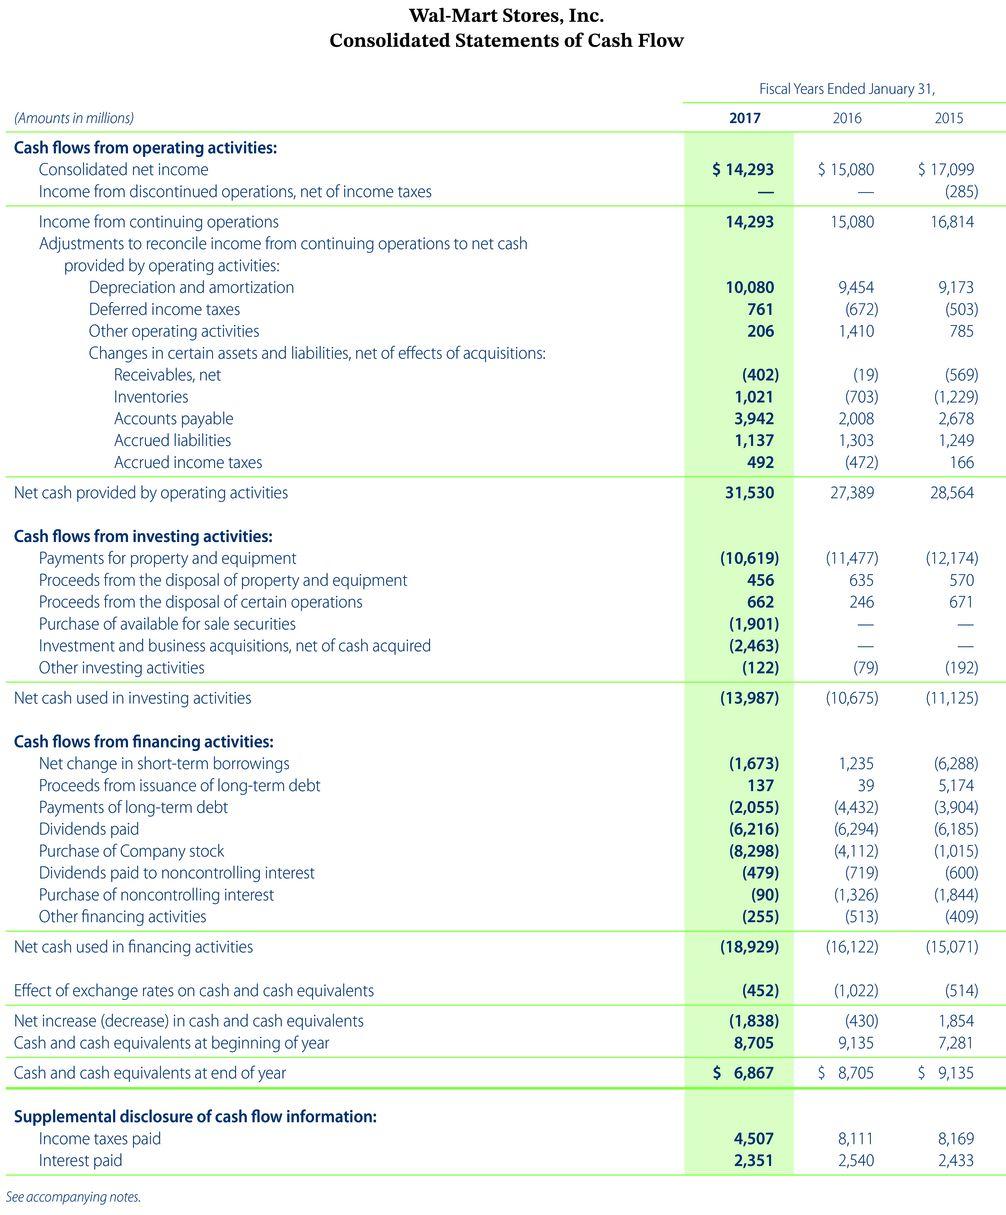
 The financial statements of Amazon.com, Inc. are presented in Appendix D. Click here to view Appendix D. Financial statements of Wal-Mart Stores, Inc. are presented in Appendix E. Click here to view Appendix E. The complete annual reports, including the notes to the financial statements, are available at each companys respective website. (a) Based on the information contained in these financial statements (For Amazon use values for December 31, 2016 and for Wal-Mart use values for January 31, 2017.), and the accompanying notes and schedules, compute the following values for each company. (Round all percentages to 1 decimal places, e.g. 15.1% and asset turnover ratio to 2 decimal places, e.g. 15.21. Enter negative amounts using either a negative sign preceding the number e.g. -45 or parentheses e.g. (45).) (1) Return on assets.
| | | Return on assets | |
| Amazon.com | | enter percentages rounded to 1 decimal place | % |
| Wal-Mart Stores | | enter percentages rounded to 1 decimal place | % |
(2) Profit margin (use Total Revenue).
| | | Profit margin | |
| Amazon.com | | enter percentages rounded to 1 decimal place | % |
| Wal-Mart Stores | | enter percentages rounded to 1 decimal place | % |
(3) Asset turnover.
| | | Asset turnover | |
| Amazon.com | | enter the asset turnover ratio rounded to 2 decimal places | times |
| Wal-Mart Stores | | enter the asset turnover ratio rounded to 2 decimal places | times |
AMAZON.COM, INC. CONSOLIDATED STATEMENTS OF CASH FLOWS (in millions) Year Ended December 31, 2014 2015 8,658 $ 14.557 S 2016 15,890 $ (241) 596 2.371 4,746 1,497 6.281 2,119 155 250 129 8,116 2.975 160 (20) (246) (829) 59 (316) (6) 81 (119) (2,187) (1,755) 4,294 (1.193) (1,039) 1.759 706 4,433 (3.692) 6,842 (1,426) (3,367) 5,030 1.724 11.931 913 7,401 (6,109) 11.920 (9.976) 16,443 CASH AND CASH EQUIVALENTS, BEGINNING OF PERIOD OPERATING ACTIVITIES: Net income (loss) Adjustments to reconcile net income (loss) to net cash from operating activities: Depreciation of property and equipment, including internal-use software and website development, and other amortization, including capitalized content costs Stock-based compensation Other operating expense, net Other expense (income), net Deferred income taxes Excess tax benefits from stock-based compensation Changes in operating assets and liabilities: Inventories Accounts receivable, net and other Accounts payable Accrued expenses and other Additions to unearned revenue Amortization of previously unearned revenue Net cash provided by (used in) operating activities INVESTING ACTIVITIES: Purchases of property and equipment, including internal-use software and website development, net Acquisitions, net of cash acquired, and other Sales and maturities of marketable securities Purchases of marketable securities Net cash provided by (used in) investing activities FINANCING ACTIVITIES: Excess tax benefits from stock-based compensation Proceeds from long-term debt and other Repayments of long-term debt and other Principal repayments of capital lease obligations Principal repayments of finance lease obligations Net cash provided by (used in) financing activities Foreign currency effect on cash and cash equivalents Net increase (decrease) in cash and cash equivalents CASH AND CASH EQUIVALENTS, END OF PERIOD SUPPLEMENTAL CASH FLOW INFORMATION: Cash paid for interest on long-term debt Cash paid for interest on capital and finance lease obligations Cash paid for income taxes, net of refunds Property and equipment acquired under capital leases Property and equipment acquired under build-to-suit leases (4.893) (979) 3,349 (2.542) (5.065) (4,589) (795) 3,025 (4,091) (6,450) (6,737) (116) 4.733 (7,756) (9,876) 6 829 6,359 621 (513) (1,285) (135) 4,432 (310) 5,899 119 353 (1.652) (2.462) (121) (3,763) (374) 1,333 (354) (3,860) (147) (2,911) (212) 3,444 $ 14,557 $ 15,890 $ 19,334 S 91 $ 86 177 325 $ 153 273 4,717 544 290 206 412 5,704 1.209 4,008 920 See accompanying notes to consolidated financial statements. Wal-Mart Stores, Inc. Consolidated Statements of Cash Flow Fiscal Years Ended January 31, 2017 2016 2015 $ 14,293 $ 15,080 $ 17,099 (285) 14,293 15,080 16,814 (Amounts in millions) Cash flows from operating activities: Consolidated net income Income from discontinued operations, net of income taxes Income from continuing operations Adjustments to reconcile income from continuing operations to net cash provided by operating activities: Depreciation and amortization Deferred income taxes Other operating activities Changes in certain assets and liabilities, net of effects of acquisitions: Receivables, net Inventories Accounts payable Accrued liabilities Accrued income taxes Net cash provided by operating activities 10,080 761 206 9,454 (672) 1,410 9,173 (503) 785 (402) 1,021 3,942 1,137 49 (19) (703) 2,008 1,303 (472) (569) (1,229) 2,678 1,249 166 31,530 27,389 28,564 (11,477) 635 246 (12,174) 570 671 Cash flows from investing activities: Payments for property and equipment Proceeds from the disposal of property and equipment Proceeds from the disposal of certain operations Purchase of available for sale securities Investment and business acquisitions, net of cash acquired Other investing activities Net cash used in investing activities (10,619) 456 662 (1,901) (2,463) (122) (79) (192) (11,125) (13,987) (10,675) Cash flows from financing activities: Net change in short-term borrowings Proceeds from issuance of long-term debt Payments of long-term debt Dividends paid Purchase of Company stock Dividends paid to noncontrolling interest Purchase of noncontrolling interest Other financing activities Net cash used in financing activities (1,673) 137 (2,055) (6,216) (8,298) (479) (90) (255) (18,929) 1,235 39 (4,432) (6,294) (4,112) (719) (1,326) (513) (6,288) 5,174 (3,904) (6,185) (1,015) (600) (1,844) (409) (16,122) (15,071) (452) (514) Effect of exchange rates on cash and cash equivalents Net increase (decrease) in cash and cash equivalents Cash and cash equivalents at beginning of year Cash and cash equivalents at end of year (1,838) 8,705 (1,022) (430) 9,135 1,854 7,281 $ 6,867 $ 8,705 $ 9,135 Supplemental disclosure of cash flow information: Income taxes paid Interest paid 4,507 2,351 8,111 2,540 8,169 2,433 See accompanying notes. AMAZON.COM, INC. CONSOLIDATED STATEMENTS OF CASH FLOWS (in millions) Year Ended December 31, 2014 2015 8,658 $ 14.557 S 2016 15,890 $ (241) 596 2.371 4,746 1,497 6.281 2,119 155 250 129 8,116 2.975 160 (20) (246) (829) 59 (316) (6) 81 (119) (2,187) (1,755) 4,294 (1.193) (1,039) 1.759 706 4,433 (3.692) 6,842 (1,426) (3,367) 5,030 1.724 11.931 913 7,401 (6,109) 11.920 (9.976) 16,443 CASH AND CASH EQUIVALENTS, BEGINNING OF PERIOD OPERATING ACTIVITIES: Net income (loss) Adjustments to reconcile net income (loss) to net cash from operating activities: Depreciation of property and equipment, including internal-use software and website development, and other amortization, including capitalized content costs Stock-based compensation Other operating expense, net Other expense (income), net Deferred income taxes Excess tax benefits from stock-based compensation Changes in operating assets and liabilities: Inventories Accounts receivable, net and other Accounts payable Accrued expenses and other Additions to unearned revenue Amortization of previously unearned revenue Net cash provided by (used in) operating activities INVESTING ACTIVITIES: Purchases of property and equipment, including internal-use software and website development, net Acquisitions, net of cash acquired, and other Sales and maturities of marketable securities Purchases of marketable securities Net cash provided by (used in) investing activities FINANCING ACTIVITIES: Excess tax benefits from stock-based compensation Proceeds from long-term debt and other Repayments of long-term debt and other Principal repayments of capital lease obligations Principal repayments of finance lease obligations Net cash provided by (used in) financing activities Foreign currency effect on cash and cash equivalents Net increase (decrease) in cash and cash equivalents CASH AND CASH EQUIVALENTS, END OF PERIOD SUPPLEMENTAL CASH FLOW INFORMATION: Cash paid for interest on long-term debt Cash paid for interest on capital and finance lease obligations Cash paid for income taxes, net of refunds Property and equipment acquired under capital leases Property and equipment acquired under build-to-suit leases (4.893) (979) 3,349 (2.542) (5.065) (4,589) (795) 3,025 (4,091) (6,450) (6,737) (116) 4.733 (7,756) (9,876) 6 829 6,359 621 (513) (1,285) (135) 4,432 (310) 5,899 119 353 (1.652) (2.462) (121) (3,763) (374) 1,333 (354) (3,860) (147) (2,911) (212) 3,444 $ 14,557 $ 15,890 $ 19,334 S 91 $ 86 177 325 $ 153 273 4,717 544 290 206 412 5,704 1.209 4,008 920 See accompanying notes to consolidated financial statements. Wal-Mart Stores, Inc. Consolidated Statements of Cash Flow Fiscal Years Ended January 31, 2017 2016 2015 $ 14,293 $ 15,080 $ 17,099 (285) 14,293 15,080 16,814 (Amounts in millions) Cash flows from operating activities: Consolidated net income Income from discontinued operations, net of income taxes Income from continuing operations Adjustments to reconcile income from continuing operations to net cash provided by operating activities: Depreciation and amortization Deferred income taxes Other operating activities Changes in certain assets and liabilities, net of effects of acquisitions: Receivables, net Inventories Accounts payable Accrued liabilities Accrued income taxes Net cash provided by operating activities 10,080 761 206 9,454 (672) 1,410 9,173 (503) 785 (402) 1,021 3,942 1,137 49 (19) (703) 2,008 1,303 (472) (569) (1,229) 2,678 1,249 166 31,530 27,389 28,564 (11,477) 635 246 (12,174) 570 671 Cash flows from investing activities: Payments for property and equipment Proceeds from the disposal of property and equipment Proceeds from the disposal of certain operations Purchase of available for sale securities Investment and business acquisitions, net of cash acquired Other investing activities Net cash used in investing activities (10,619) 456 662 (1,901) (2,463) (122) (79) (192) (11,125) (13,987) (10,675) Cash flows from financing activities: Net change in short-term borrowings Proceeds from issuance of long-term debt Payments of long-term debt Dividends paid Purchase of Company stock Dividends paid to noncontrolling interest Purchase of noncontrolling interest Other financing activities Net cash used in financing activities (1,673) 137 (2,055) (6,216) (8,298) (479) (90) (255) (18,929) 1,235 39 (4,432) (6,294) (4,112) (719) (1,326) (513) (6,288) 5,174 (3,904) (6,185) (1,015) (600) (1,844) (409) (16,122) (15,071) (452) (514) Effect of exchange rates on cash and cash equivalents Net increase (decrease) in cash and cash equivalents Cash and cash equivalents at beginning of year Cash and cash equivalents at end of year (1,838) 8,705 (1,022) (430) 9,135 1,854 7,281 $ 6,867 $ 8,705 $ 9,135 Supplemental disclosure of cash flow information: Income taxes paid Interest paid 4,507 2,351 8,111 2,540 8,169 2,433 See accompanying notes

 The financial statements of Amazon.com, Inc. are presented in Appendix D. Click here to view Appendix D. Financial statements of Wal-Mart Stores, Inc. are presented in Appendix E. Click here to view Appendix E. The complete annual reports, including the notes to the financial statements, are available at each companys respective website. (a) Based on the information contained in these financial statements (For Amazon use values for December 31, 2016 and for Wal-Mart use values for January 31, 2017.), and the accompanying notes and schedules, compute the following values for each company. (Round all percentages to 1 decimal places, e.g. 15.1% and asset turnover ratio to 2 decimal places, e.g. 15.21. Enter negative amounts using either a negative sign preceding the number e.g. -45 or parentheses e.g. (45).) (1) Return on assets.


