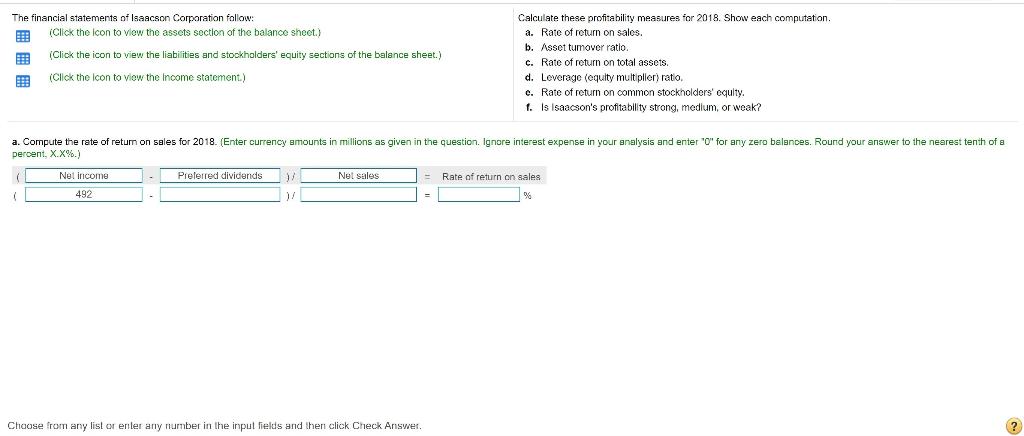
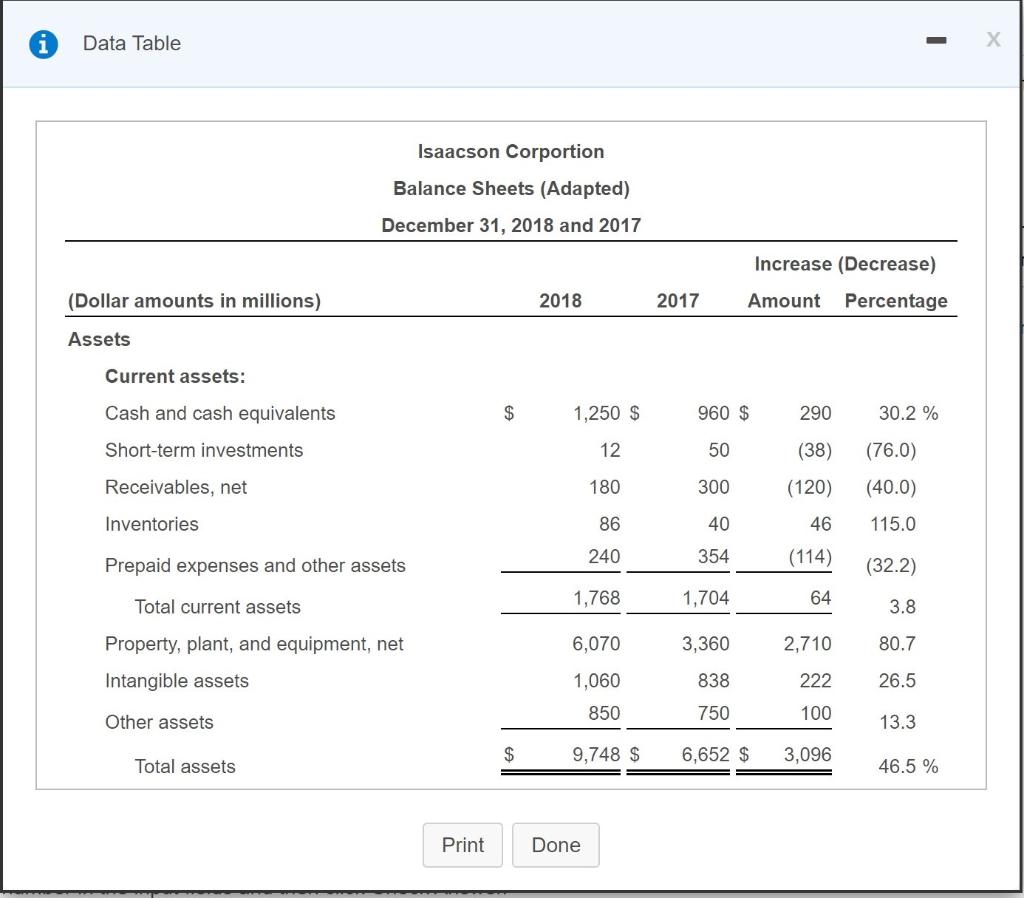
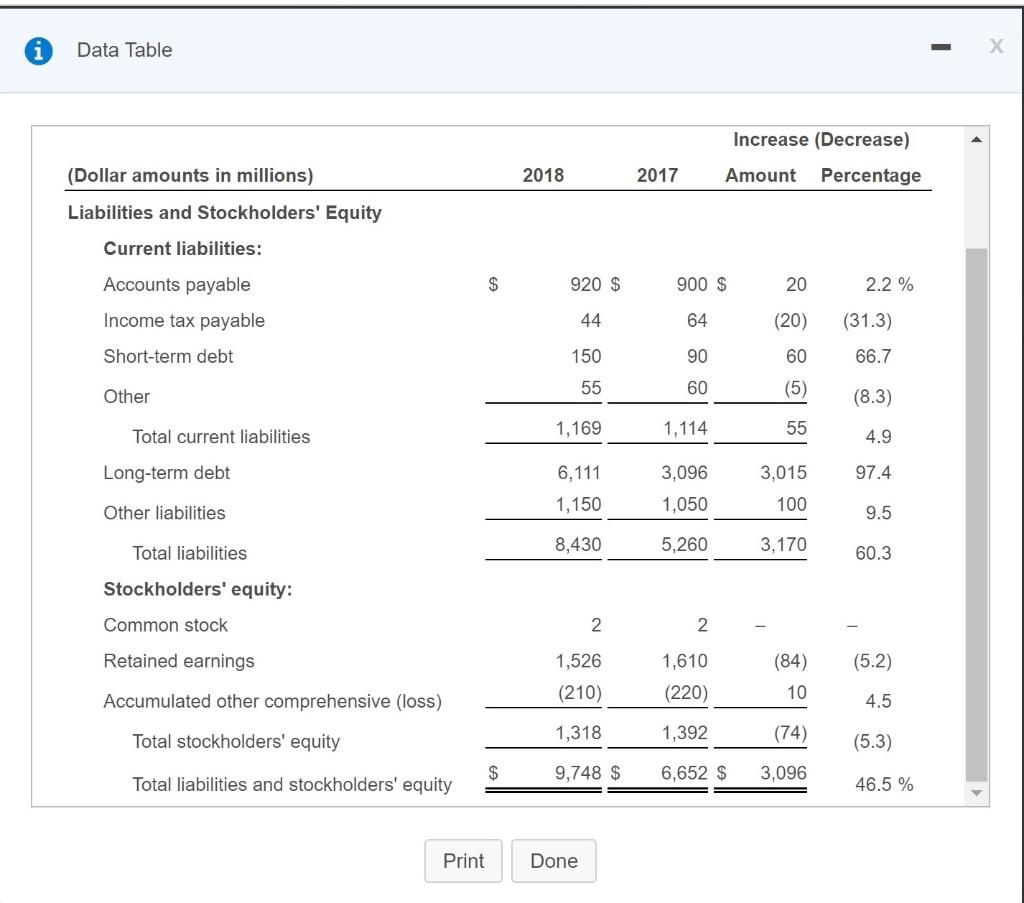
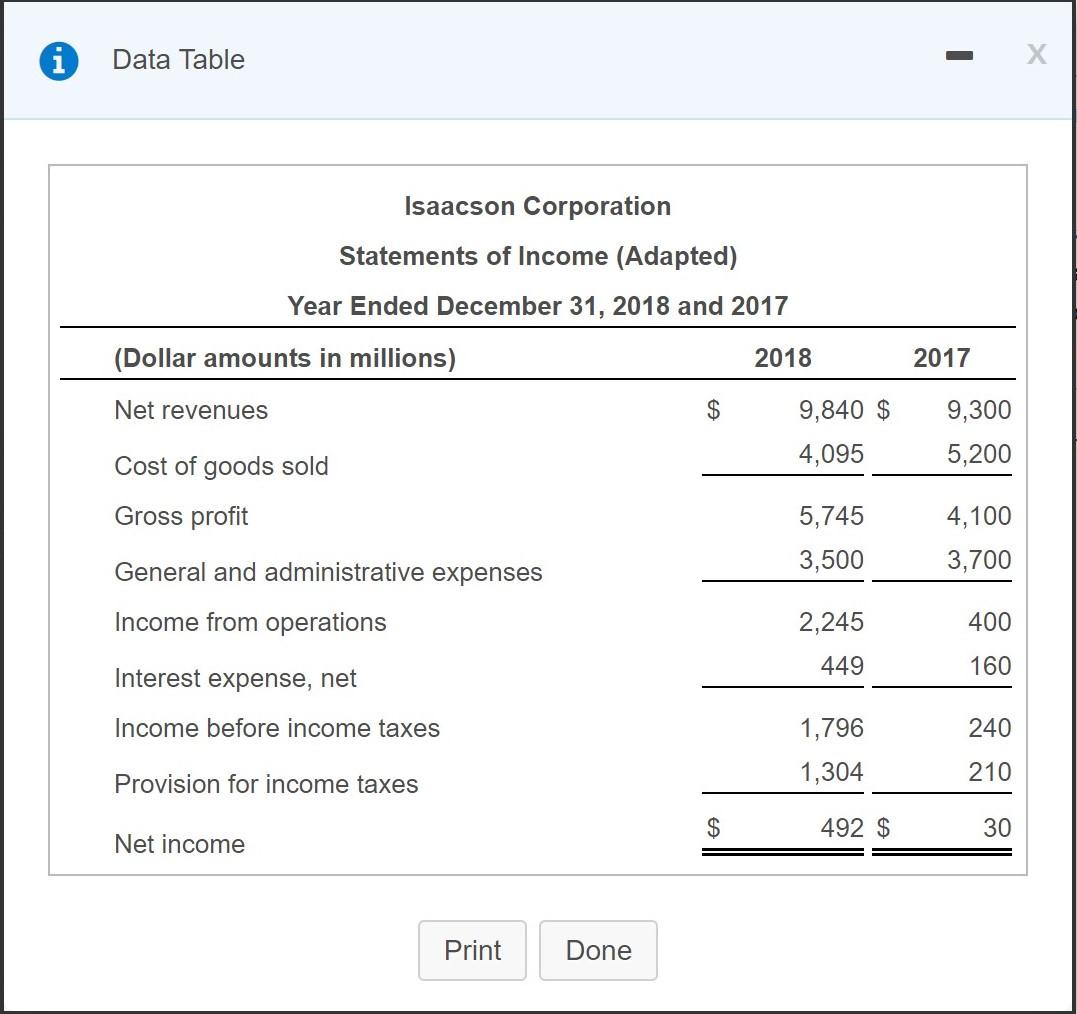
The financial statements of Isaacson Corporation follow: (Click the icon to view the assets section of the balance sheet.) BE: (Click the icon to view the liabilities and stockholders' equity sections of the balance sheet.) 28 (Click the icon to view the Income statement.) Calculate these profitability measures for 2018. Show each computation. a. Rate of return on sales, b. Asset tumover ratio. c. Rate of return on total assets. d. Leverage (equity multiplier) ratio. c. Rate of return on common stockholders' equity. 1. Is Isaacson's profitability strong, medium, or weak? a. Compute the rate of retum percent. X.X%) sales for 2018. (Enter currency amounts in millions as given in the question. Ignore interest expense in your analysis and enter 'O' for any zero balances. Round your answer to the nearest tenth of a Nel income Preferred dividends 17 Net sales - Rate of return on sales 492 ) % Choose from any list or enter any number in the input fields and then click Check Answer. ? Data Table x Isaacson Corportion Balance Sheets (Adapted) December 31, 2018 and 2017 Increase (Decrease) (Dollar amounts in millions) 2018 2017 Amount Percentage Assets Current assets: Cash and cash equivalents $ 1,250 $ 960 $ 290 30.2 % Short-term investments 12 50 (38) (76.0) Receivables, net 180 300 (120) (40.0) Inventories 86 40 46 115.0 240 354 Prepaid expenses and other assets (114) (32.2) 1,768 Total current assets 1,704 64 3.8 6,070 3,360 2,710 80.7 Property, plant, and equipment, net Intangible assets 1,060 838 222 26.5 850 750 100 Other assets 13.3 $ 9,748 $ 6,652 $ 3,096 Total assets 46.5 % Print Done Data Table Increase (Decrease) Amount Percentage 2018 2017 (Dollar amounts in millions) Liabilities and Stockholders' Equity Current liabilities: Accounts payable Income tax payable $ 920 $ 900 $ 20 2.2 % 44 64 (20) (31.3) Short-term debt 150 90 60 66.7 55 60 Other (5) (8.3) 1,169 1,114 55 Total current liabilities 4.9 Long-term debt 6,111 3,015 97.4 3,096 1,050 1,150 100 Other liabilities 9.5 8,430 Total liabilities 5,260 3,170 60.3 Stockholders' equity: Common stock 2 2 Retained earnings (84) (5.2) 1,526 (210) 1,610 (220) Accumulated other comprehensive (loss) 10 4.5 Total stockholders' equity 1,318 1,392 (74) (5.3) $ 9,748 $ 6,652 $ 3,096 Total liabilities and stockholders' equity 46.5 % Print Done i Data Table - Isaacson Corporation Statements of Income (Adapted) Year Ended December 31, 2018 and 2017 (Dollar amounts in millions) 2018 2017 Net revenues $ 9,840 $ 4,095 9,300 5,200 Cost of goods sold Gross profit 5,745 3,500 4,100 3,700 General and administrative expenses Income from operations 2,245 400 449 160 Interest expense, net Income before income taxes 240 1,796 1,304 210 Provision for income taxes $ 492 $ 30 Net income Print Done


