

Question
The firm has forecasted sales of $7,100,000 and a tax rate of 40% for 2018. Cost of goods sold and S,G&A expense in 2018 are
The firm has forecasted sales of $7,100,000 and a tax rate of 40% for 2018. Cost of goods sold and S,G&A expense in 2018 are expected to be the average of their two-year proportion of sales. On the balance sheet, accounts receivable, inventory, accounts payable, and accrued expenses are expected to be at the two-year average of the proportion of these items in relation to sales. The firm has planned an investment of $500,000 in fixed assets in 2018, with an estimated life of 10 years and no salvage value. These fixed assets will be depreciated using the straight line depreciation method. All other financial statement items are expected to remain constant in 2018. Assume the firm pays 4% interest on short-term debt and 7% on long term debt. Assume that the dividends in 2018 will be the same as those paid in 2017.
A) ADD A COLUM FOR 2018 IN BOTH INCOME STATEMENT AND BALANCE SHEET B)What is the Discretionary Financing Needed (DFN) in 2018? Is this a surplus or deficit?
C)DFN will be absorbed by long-term debt. Set up an iterative worksheet to eliminate it.
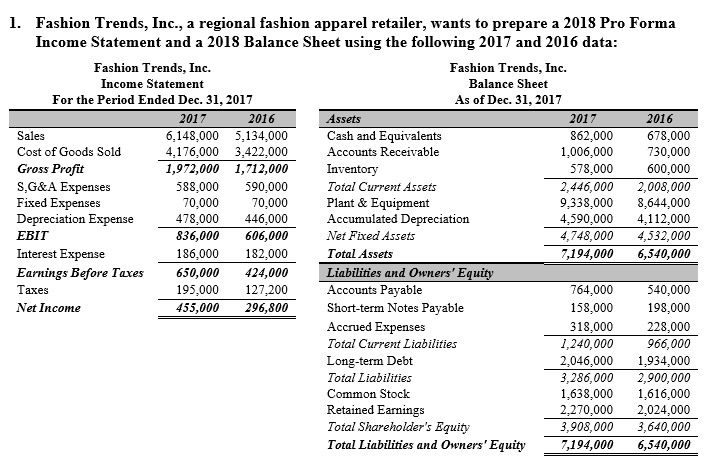
1. Fashion Trends, Inc., a regional fashion apparel retailer, wants to prepare a 2018 Pro Forma Income Statement and a 2018 Balance Sheet using the following 2017 and 2016 data Fashion Trends, Inc. Income Statement For the Period Ended Dec. 31,2017 Fashion Trends. Inc. Balance Sheet As of Dec. 31, 2017 2016 2017 862,000 2016 Assets Cash and Equivalents Accounts Receivable Inventory Total Current Assets Plant & Equipment Accumulated Depreciation Net Fixed Assets Total Assets Liabilities and Owners Equ Accounts Payable Short-term Notes Payable Accrued Expenses Total Current Liabilities Long-term Debt Total Liabilities Common Stock Retained Earnings Total Shareholder's Equity Total Liabilities and Owners'Equity Sales Cost of Goods Sold Gross Profit S,G&A Expenses Fixed Expenses Depreciation Expense EBIT Interest Expense 6,148,000 5,134,000 4,176.000 3.422.000 1,972,000 1,712,000 588,000 590,000 70,000 478.000 446.000 836,000 606,000 186.000 182.000 Earnings Before Taxes650,000 424,000 195,000 127,200 455,000296,800 678,000 730,000 600,000 2,446,000 2,008,000 9,338,000 8,644,000 4.590,000 4.112,000 4,748,000 4,532,000 ,194,0006,540,000 1,006,000 578,000 70,000 540,000 198,000 228,000 966,000 2.046,000 1.934,000 3,286,000 2,900,000 1,638,000 1,616,000 2,270,000 2,024,000 3,908,000 3,640,000 ,194,0006,540,000 764,000 158,000 318,000 1,240,000 axes Net Income 1. Fashion Trends, Inc., a regional fashion apparel retailer, wants to prepare a 2018 Pro Forma Income Statement and a 2018 Balance Sheet using the following 2017 and 2016 data Fashion Trends, Inc. Income Statement For the Period Ended Dec. 31,2017 Fashion Trends. Inc. Balance Sheet As of Dec. 31, 2017 2016 2017 862,000 2016 Assets Cash and Equivalents Accounts Receivable Inventory Total Current Assets Plant & Equipment Accumulated Depreciation Net Fixed Assets Total Assets Liabilities and Owners Equ Accounts Payable Short-term Notes Payable Accrued Expenses Total Current Liabilities Long-term Debt Total Liabilities Common Stock Retained Earnings Total Shareholder's Equity Total Liabilities and Owners'Equity Sales Cost of Goods Sold Gross Profit S,G&A Expenses Fixed Expenses Depreciation Expense EBIT Interest Expense 6,148,000 5,134,000 4,176.000 3.422.000 1,972,000 1,712,000 588,000 590,000 70,000 478.000 446.000 836,000 606,000 186.000 182.000 Earnings Before Taxes650,000 424,000 195,000 127,200 455,000296,800 678,000 730,000 600,000 2,446,000 2,008,000 9,338,000 8,644,000 4.590,000 4.112,000 4,748,000 4,532,000 ,194,0006,540,000 1,006,000 578,000 70,000 540,000 198,000 228,000 966,000 2.046,000 1.934,000 3,286,000 2,900,000 1,638,000 1,616,000 2,270,000 2,024,000 3,908,000 3,640,000 ,194,0006,540,000 764,000 158,000 318,000 1,240,000 axes Net IncomeStep by Step Solution
There are 3 Steps involved in it
Step: 1

Get Instant Access to Expert-Tailored Solutions
See step-by-step solutions with expert insights and AI powered tools for academic success
Step: 2

Step: 3
Ace Your Homework with AI
Get the answers you need in no time with our AI-driven, step-by-step assistance
Get Started
Cost Accounting Foundations and Evolutions
Authors: Michael R. Kinney, Cecily A. Raiborn
8th Edition
9781439044612, 1439044619, 978-1111626822