

Answered step by step
Verified Expert Solution
Question
1 Approved Answer
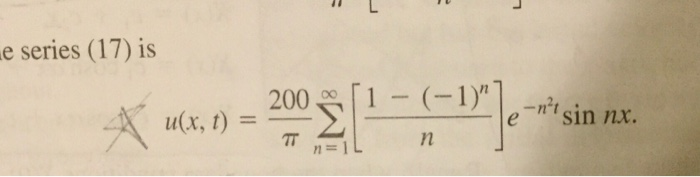
The first attachment gives the summation. Using Matlab, create a plot for temperature u as a function of time t and distance x on a
The first attachment gives the summation. Using Matlab, create a plot for temperature u as a function of time t and distance x on a surface in 3-dimensional space. The simulation should be run until the variation of temperature is less than 0.1 along the rod.
Step by Step Solution
There are 3 Steps involved in it
Step: 1

Get Instant Access to Expert-Tailored Solutions
See step-by-step solutions with expert insights and AI powered tools for academic success
Step: 2

Step: 3
Ace Your Homework with AI
Get the answers you need in no time with our AI-driven, step-by-step assistance
Get Started
Database Processing Fundamentals, Design, and Implementation
Authors: David M. Kroenke, David J. Auer
14th edition
133876705, 9781292107639, 1292107634, 978-0133876703