

Question
The first images gives some data for the exercise and the second one is the one that specify the problem that is need to be
The first images gives some data for the exercise and the second one is the one that specify the problem that is need to be solved and on the last page is how the output should look.
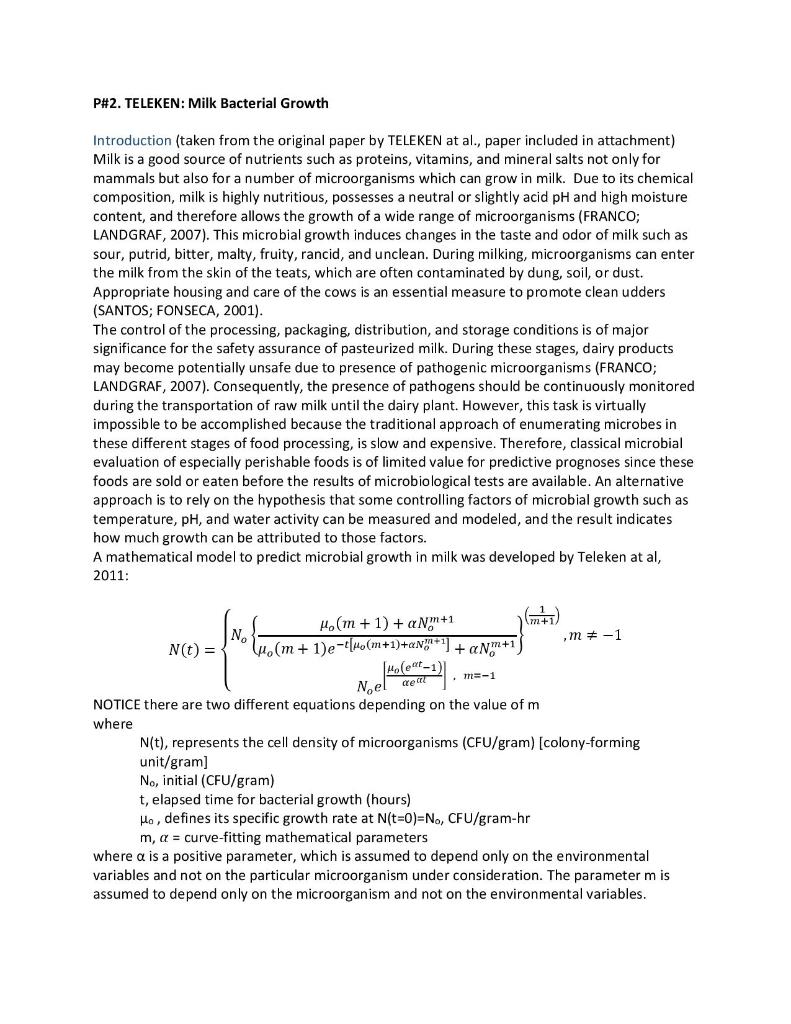
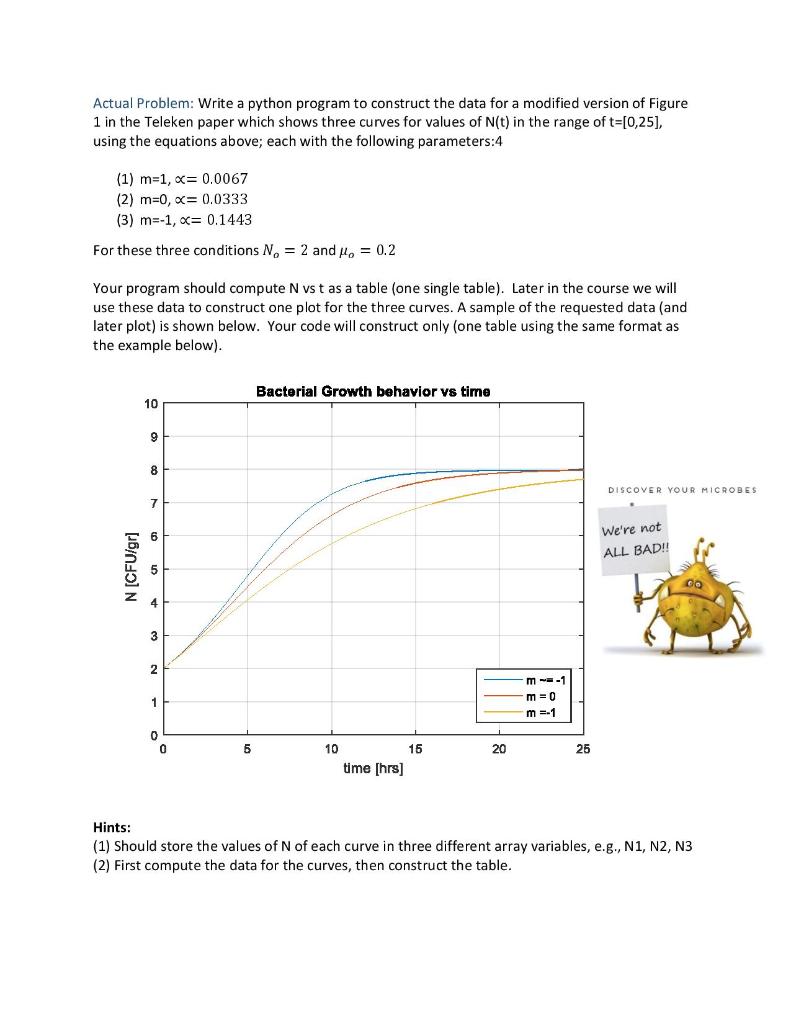
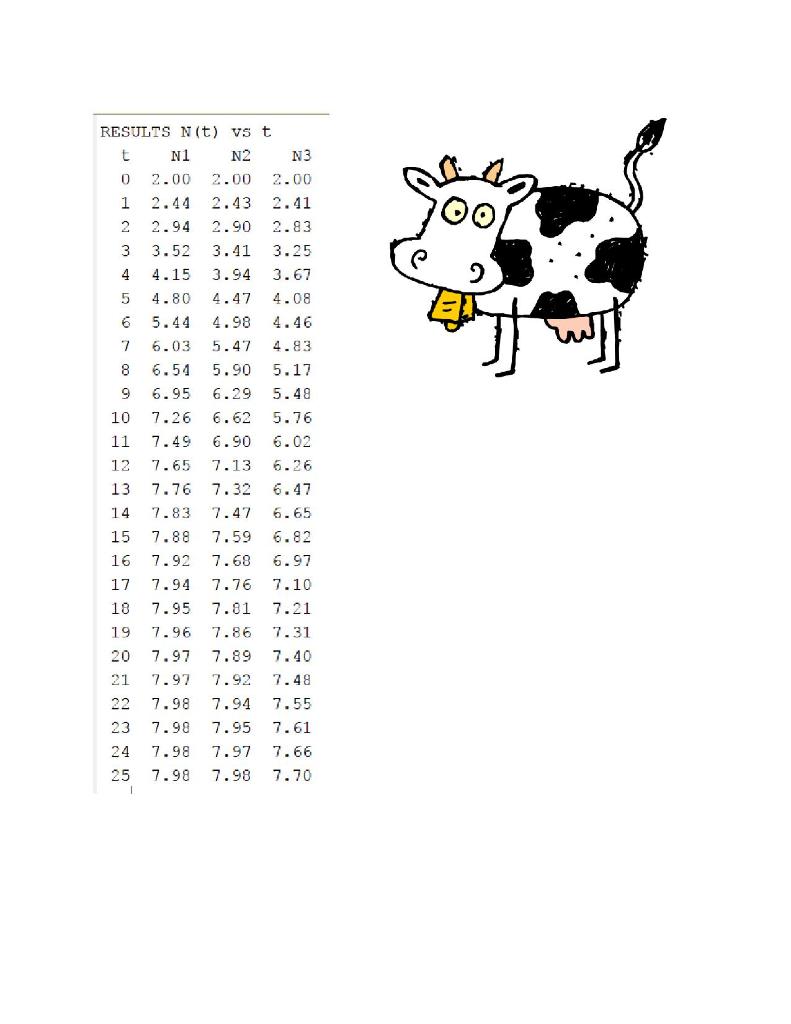
P#2. TELEKEN: Milk Bacterial Growth Introduction (taken from the original paper by TELEKEN at al., paper included in attachment) Milk is a good source of nutrients such as proteins, vitamins, and mineral salts not only for mammals but also for a number of microorganisms which can grow in milk. Due to its chemical composition, milk is highly nutritious, possesses a neutral or slightly acid pH and high moisture content, and therefore allows the growth of a wide range of microorganisms (FRANCO; LANDGRAF, 2007). This microbial growth induces changes in the taste and odor of milk such as sour, putrid, bitter, malty, fruity, rancid, and unclean. During milking, microorganisms can enter the milk from the skin of the teats, which are often contaminated by dung, soil, or dust. Appropriate housing and care of the cows is an essential measure to promote clean udders (SANTOS; FONSECA, 2001). The control of the processing, packaging, distribution, and storage conditions is of major significance for the safety assurance of pasteurized milk. During these stages, dairy products may become potentially unsafe due to presence of pathogenic microorganisms (FRANCO; LANDGRAF, 2007). Consequently, the presence of pathogens should be continuously monitored during the transportation of raw milk until the dairy plant. However, this task is virtually impossible to be accomplished because the traditional approach of enumerating microbes in these different stages of food processing, is slow and expensive. Therefore, classical microbial evaluation of especially perishable foods is of limited value for predictive prognoses since these foods are sold or eaten before the results of microbiological tests are available. An alternative approach is to rely on the hypothesis that some controlling factors of microbial growth such as temperature, pH, and water activity can be measured and modeled, and the result indicates how much growth can be attributed to those factors. A mathematical model to predict microbial growth in milk was developed by Teleken at al, 2011: N(t) = H.(m + 1) + aN+1 (+1) N. \.(m + 1)e-1[40(m+1)+n%+1+ anm+1 m-1 Moet-1)] me-1 NOTICE there are two different equations depending on the value of m where N(t), represents the cell density of microorganisms (CFU/gram) (colony-forming unit/gram] No, initial (CFU/gram) t, elapsed time for bacterial growth (hours) Ha, defines its specific growth rate at N(t=0)=N., CFU/gram-hr m, a = curve-fitting mathematical parameters where a is a positive parameter, which is assumed to depend only on the environmental variables and not on the particular microorganism under consideration. The parameter m is assumed to depend only on the microorganism and not on the environmental variables. Actual Problem: Write a python program to construct the data for a modified version of Figure 1 in the Teleken paper which shows three curves for values of N(t) in the range of t={0,25), using the equations above; each with the following parameters:4 (1) m=1,= 0.0067 (2) m=0, x= 0.0333 (3) m=-1,= 0.1443 For these three conditions N = 2 and M = 0.2 Your program should compute N vs t as a table (one single table). Later in the course we will use these data to construct one plot for the three curves. A sample of the requested data (and later plot) is shown below. Your code will construct only (one table using the same format as the example below). Bacterial Growth behavior vs time 10 9 8 DISCOVER YOUR MICRODES 7 We're not ALL BAD!! N (CFU/gr] GO 3 2 m-1 m=0 m = 1 1 0 0 5 10 20 25 15 time [hrs] Hints: (1) Should store the values of N of each curve in three different array variables, e.g., N1, N2, N3 (2) First compute the data for the curves, then construct the table. 100 RESULTS N(t) vs t t N1 N2 N3 0 2.00 2.00 2.00 1 2.44 2.43 2.41 2 2.94 2.90 2.83 3 3.52 3.41 3.25 4 4.15 3.94 3.67 5 4.80 4.47 4.08 6 5.44 4.98 4.46 7 6.03 5.47 4.83 8 6.54 5.90 5.17 9 6.95 6.29 5.48 10 7.26 6.62 5.76 11 7.49 6.90 6.02 12 7.65 7.13 13 7.76 7.32 6.47 14 7.83 7.47 6.65 15 7.88 7.59 6.82 16 7.92 7.68 6.97 17 7.94 7.76 7.10 18 7.95 7.81 7.21 19 7.96 7.86 7.31 20 7.97 7.89 7.40 21 7.97 7.92 7.48 22 7.98 7.94 7.55 23 7.98 7.95 7.61 24 7.98 7.97 7.66 25 7.98 7.98 7.70 P#2. TELEKEN: Milk Bacterial Growth Introduction (taken from the original paper by TELEKEN at al., paper included in attachment) Milk is a good source of nutrients such as proteins, vitamins, and mineral salts not only for mammals but also for a number of microorganisms which can grow in milk. Due to its chemical composition, milk is highly nutritious, possesses a neutral or slightly acid pH and high moisture content, and therefore allows the growth of a wide range of microorganisms (FRANCO; LANDGRAF, 2007). This microbial growth induces changes in the taste and odor of milk such as sour, putrid, bitter, malty, fruity, rancid, and unclean. During milking, microorganisms can enter the milk from the skin of the teats, which are often contaminated by dung, soil, or dust. Appropriate housing and care of the cows is an essential measure to promote clean udders (SANTOS; FONSECA, 2001). The control of the processing, packaging, distribution, and storage conditions is of major significance for the safety assurance of pasteurized milk. During these stages, dairy products may become potentially unsafe due to presence of pathogenic microorganisms (FRANCO; LANDGRAF, 2007). Consequently, the presence of pathogens should be continuously monitored during the transportation of raw milk until the dairy plant. However, this task is virtually impossible to be accomplished because the traditional approach of enumerating microbes in these different stages of food processing, is slow and expensive. Therefore, classical microbial evaluation of especially perishable foods is of limited value for predictive prognoses since these foods are sold or eaten before the results of microbiological tests are available. An alternative approach is to rely on the hypothesis that some controlling factors of microbial growth such as temperature, pH, and water activity can be measured and modeled, and the result indicates how much growth can be attributed to those factors. A mathematical model to predict microbial growth in milk was developed by Teleken at al, 2011: N(t) = H.(m + 1) + aN+1 (+1) N. \.(m + 1)e-1[40(m+1)+n%+1+ anm+1 m-1 Moet-1)] me-1 NOTICE there are two different equations depending on the value of m where N(t), represents the cell density of microorganisms (CFU/gram) (colony-forming unit/gram] No, initial (CFU/gram) t, elapsed time for bacterial growth (hours) Ha, defines its specific growth rate at N(t=0)=N., CFU/gram-hr m, a = curve-fitting mathematical parameters where a is a positive parameter, which is assumed to depend only on the environmental variables and not on the particular microorganism under consideration. The parameter m is assumed to depend only on the microorganism and not on the environmental variables. Actual Problem: Write a python program to construct the data for a modified version of Figure 1 in the Teleken paper which shows three curves for values of N(t) in the range of t={0,25), using the equations above; each with the following parameters:4 (1) m=1,= 0.0067 (2) m=0, x= 0.0333 (3) m=-1,= 0.1443 For these three conditions N = 2 and M = 0.2 Your program should compute N vs t as a table (one single table). Later in the course we will use these data to construct one plot for the three curves. A sample of the requested data (and later plot) is shown below. Your code will construct only (one table using the same format as the example below). Bacterial Growth behavior vs time 10 9 8 DISCOVER YOUR MICRODES 7 We're not ALL BAD!! N (CFU/gr] GO 3 2 m-1 m=0 m = 1 1 0 0 5 10 20 25 15 time [hrs] Hints: (1) Should store the values of N of each curve in three different array variables, e.g., N1, N2, N3 (2) First compute the data for the curves, then construct the table. 100 RESULTS N(t) vs t t N1 N2 N3 0 2.00 2.00 2.00 1 2.44 2.43 2.41 2 2.94 2.90 2.83 3 3.52 3.41 3.25 4 4.15 3.94 3.67 5 4.80 4.47 4.08 6 5.44 4.98 4.46 7 6.03 5.47 4.83 8 6.54 5.90 5.17 9 6.95 6.29 5.48 10 7.26 6.62 5.76 11 7.49 6.90 6.02 12 7.65 7.13 13 7.76 7.32 6.47 14 7.83 7.47 6.65 15 7.88 7.59 6.82 16 7.92 7.68 6.97 17 7.94 7.76 7.10 18 7.95 7.81 7.21 19 7.96 7.86 7.31 20 7.97 7.89 7.40 21 7.97 7.92 7.48 22 7.98 7.94 7.55 23 7.98 7.95 7.61 24 7.98 7.97 7.66 25 7.98 7.98 7.70Step by Step Solution
There are 3 Steps involved in it
Step: 1

Get Instant Access to Expert-Tailored Solutions
See step-by-step solutions with expert insights and AI powered tools for academic success
Step: 2

Step: 3
Ace Your Homework with AI
Get the answers you need in no time with our AI-driven, step-by-step assistance
Get Started
Machine Learning And Knowledge Discovery In Databases European Conference Ecml Pkdd 2019 Wurzburg Germany September 16 20 2019 Proceedings Part 2 Lnai 11907
Authors: Ulf Brefeld ,Elisa Fromont ,Andreas Hotho ,Arno Knobbe ,Marloes Maathuis ,Celine Robardet
1st Edition
3030461467, 978-3030461461