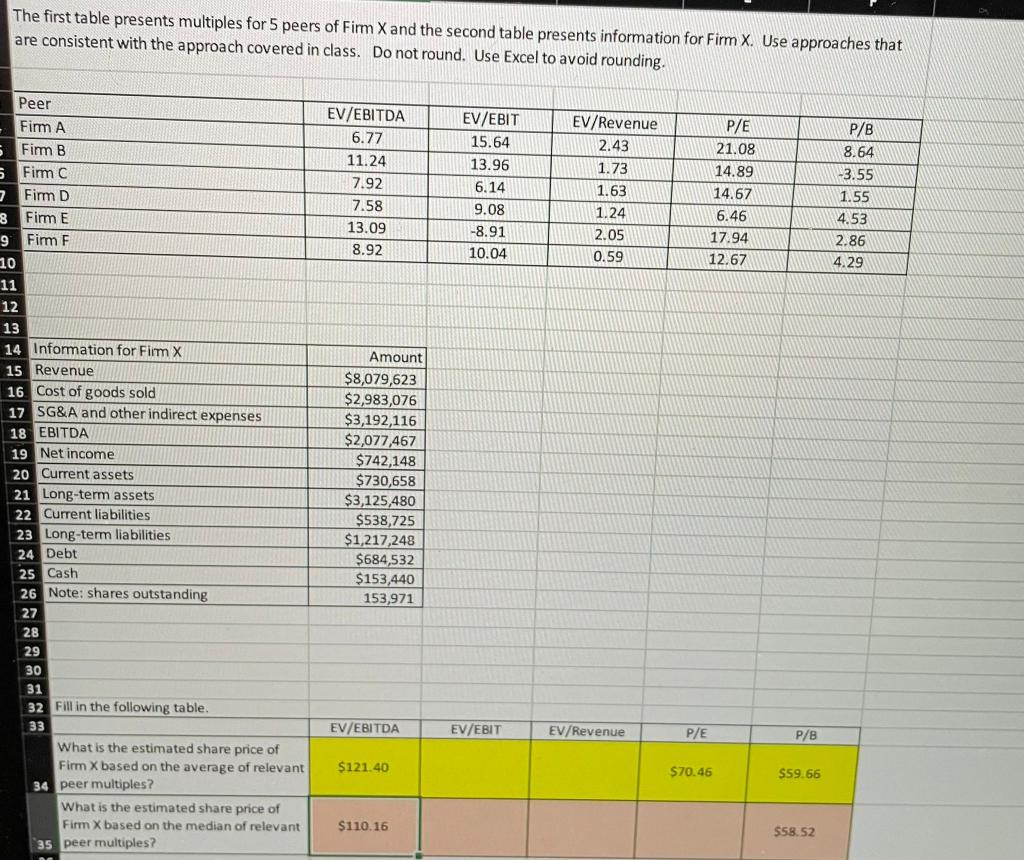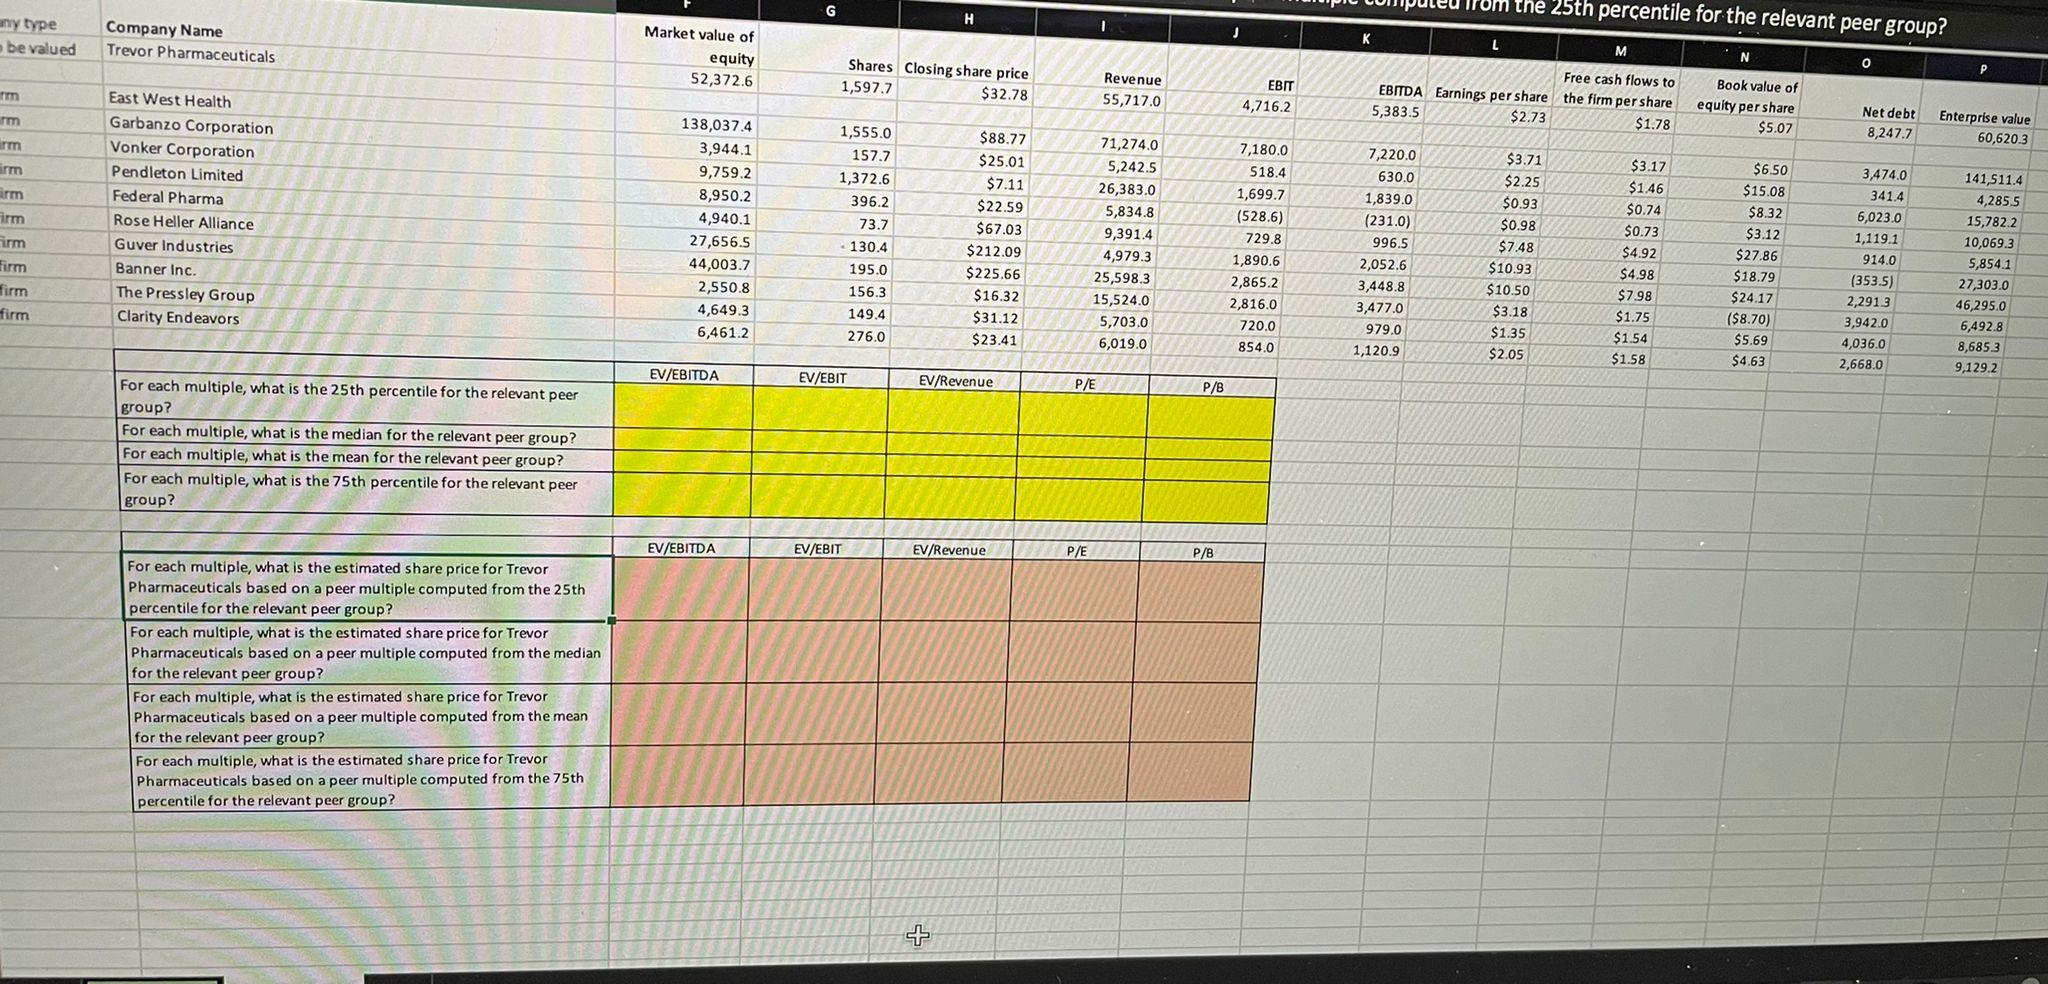

The first table presents multiples for 5 peers of Firm X and the second table presents information for Firm X. Use approaches that are consistent with the approach covered in class. Do not round. Use Excel to avoid rounding. Peer EV/EBITDA 6.77 11.24 7.92 7.58 13.09 8.92 P/E 21.08 14.89 EV/EBIT 15.64 13.96 6.14 9.08 -8.91 10.04 EV/Revenue 2.43 1.73 1.63 1.24 14.67 P/B 8.64 -3.55 1.55 4.53 2.86 4.29 2.05 0.59 6.46 17.94 12.67 Fimm A Fimm B 5 Fim C 7 Firm D 8 Firm E 9 Firm F 10 11 12 13 14 Information for Firm X 15 Revenue 16 Cost of goods sold 17 SG&A and other indirect expenses 18 EBITDA 19 Net income 20 Current assets 21 Long-term assets 22 Current liabilities 23 Long-term liabilities 24 Debt 25 Cash 26 Note: shares outstanding 27 28 29 30 31 32 Fill in the following table. 33 What is the estimated share price of Firm X based on the average of relevant 34 peer multiples? What is the estimated share price of Firm X based on the median of relevant 35 peer multiples? Amount $8,079,623 $2,983,076 $3,192,116 $2,077,467 $742,148 $730,658 $3,125,480 $538,725 $1,217,248 $684,532 $153,440 153,971 EV/EBITDA EV/EBIT EV/Revenue P/E P/B $121.40 $70.46 $59.66 $110.16 $58.52 G om the 25th percentile for the relevant peer group? H any type be valued Company Name Trevor Pharmaceuticals L Market value of equity 52,372.6 N 0 Shares Closing share price 1,597.7 $32.78 Revenue 55,717.0 im m EBIT 4,716.2 Free cash flows to EBITDA Earnings per share the firm per share 5,383.5 $2.73 $1.78 Book value of equity per share $5.07 Net debt 8,247.7 Enterprise value 60,620.3 im arm firm East West Health Garbanzo Corporation Vonker Corporation Pendleton Limited Federal Pharma Rose Heller Alliance Guver Industries Banner Inc. The Pressley Group Clarity Endeavors 138,037.4 3,944.1 9,759.2 8,950.2 4,940.1 27,656.5 44,003.7 2,550.8 4,649.3 6,461.2 irm 1,555.0 157.7 1,372.6 396.2 73.7 130.4 195.0 156.3 149.4 $6.50 $15.08 $8.32 $3.12 $88.77 $25.01 $7.11 $22.59 $67.03 $212.09 $225.66 $16.32 $31.12 $23.41 Firm 71,274.0 5,242.5 26,383.0 5,834.8 9,391.4 4,979.3 25,598.3 15,524.0 5,703.0 6,019.0 7,180.0 518.4 1,699.7 (528.6) 729.8 1,890.6 2,865.2 2,816.0 720.0 854.0 7,220.0 630.0 1,839.0 (231.0) 996.5 2,052.6 3,448.8 3,477.0 979.0 1,120.9 $3.71 $2.25 $0.93 $0.98 $7.48 $10.93 $10.50 $3.18 $1.35 $2.05 $3.17 $1.46 $0.74 $0.73 $4.92 $4.98 $7.98 $1.75 $1.54 $1.58 $27.86 Firm firm firm $18.79 $24.17 ($8.70) $5.69 $4.63 3,474.0 341.4 6,023.0 1,119.1 914.0 (353.5) 2,291.3 3,942.0 4,036.0 2,668.0 141,511.4 4,285,5 15,7822 10,069.3 5,854.1 27,303.0 46,295.0 6,492.8 8,685.3 9,129.2 276.0 EV/EBITDA EV/EBIT EV/Revenue P/E P/B For each multiple, what is the 25th percentile for the relevant peer group? For each multiple, what is the median for the relevant peer group? For each multiple, what is the mean for the relevant peer group? For each multiple, what is the 75th percentile for the relevant peer group? EV/EBITDA EV/EBIT EV/Revenue P/E P/B For each multiple, what is the estimated share price for Trevor Pharmaceuticals based on a peer multiple computed from the 25th percentile for the relevant peer group? For each multiple, what is the estimated share price for Trevor Pharmaceuticals based on a peer multiple computed from the median for the relevant peer group? For each multiple, what is the estimated share price for Trevor Pharmaceuticals based on a peer multiple computed from the mean for the relevant peer group? For each multiple, what is the estimated share price for Trevor Pharmaceuticals based on a peer multiple computed from the 75th percentile for the relevant peer group? T The first table presents multiples for 5 peers of Firm X and the second table presents information for Firm X. Use approaches that are consistent with the approach covered in class. Do not round. Use Excel to avoid rounding. Peer EV/EBITDA 6.77 11.24 7.92 7.58 13.09 8.92 P/E 21.08 14.89 EV/EBIT 15.64 13.96 6.14 9.08 -8.91 10.04 EV/Revenue 2.43 1.73 1.63 1.24 14.67 P/B 8.64 -3.55 1.55 4.53 2.86 4.29 2.05 0.59 6.46 17.94 12.67 Fimm A Fimm B 5 Fim C 7 Firm D 8 Firm E 9 Firm F 10 11 12 13 14 Information for Firm X 15 Revenue 16 Cost of goods sold 17 SG&A and other indirect expenses 18 EBITDA 19 Net income 20 Current assets 21 Long-term assets 22 Current liabilities 23 Long-term liabilities 24 Debt 25 Cash 26 Note: shares outstanding 27 28 29 30 31 32 Fill in the following table. 33 What is the estimated share price of Firm X based on the average of relevant 34 peer multiples? What is the estimated share price of Firm X based on the median of relevant 35 peer multiples? Amount $8,079,623 $2,983,076 $3,192,116 $2,077,467 $742,148 $730,658 $3,125,480 $538,725 $1,217,248 $684,532 $153,440 153,971 EV/EBITDA EV/EBIT EV/Revenue P/E P/B $121.40 $70.46 $59.66 $110.16 $58.52 G om the 25th percentile for the relevant peer group? H any type be valued Company Name Trevor Pharmaceuticals L Market value of equity 52,372.6 N 0 Shares Closing share price 1,597.7 $32.78 Revenue 55,717.0 im m EBIT 4,716.2 Free cash flows to EBITDA Earnings per share the firm per share 5,383.5 $2.73 $1.78 Book value of equity per share $5.07 Net debt 8,247.7 Enterprise value 60,620.3 im arm firm East West Health Garbanzo Corporation Vonker Corporation Pendleton Limited Federal Pharma Rose Heller Alliance Guver Industries Banner Inc. The Pressley Group Clarity Endeavors 138,037.4 3,944.1 9,759.2 8,950.2 4,940.1 27,656.5 44,003.7 2,550.8 4,649.3 6,461.2 irm 1,555.0 157.7 1,372.6 396.2 73.7 130.4 195.0 156.3 149.4 $6.50 $15.08 $8.32 $3.12 $88.77 $25.01 $7.11 $22.59 $67.03 $212.09 $225.66 $16.32 $31.12 $23.41 Firm 71,274.0 5,242.5 26,383.0 5,834.8 9,391.4 4,979.3 25,598.3 15,524.0 5,703.0 6,019.0 7,180.0 518.4 1,699.7 (528.6) 729.8 1,890.6 2,865.2 2,816.0 720.0 854.0 7,220.0 630.0 1,839.0 (231.0) 996.5 2,052.6 3,448.8 3,477.0 979.0 1,120.9 $3.71 $2.25 $0.93 $0.98 $7.48 $10.93 $10.50 $3.18 $1.35 $2.05 $3.17 $1.46 $0.74 $0.73 $4.92 $4.98 $7.98 $1.75 $1.54 $1.58 $27.86 Firm firm firm $18.79 $24.17 ($8.70) $5.69 $4.63 3,474.0 341.4 6,023.0 1,119.1 914.0 (353.5) 2,291.3 3,942.0 4,036.0 2,668.0 141,511.4 4,285,5 15,7822 10,069.3 5,854.1 27,303.0 46,295.0 6,492.8 8,685.3 9,129.2 276.0 EV/EBITDA EV/EBIT EV/Revenue P/E P/B For each multiple, what is the 25th percentile for the relevant peer group? For each multiple, what is the median for the relevant peer group? For each multiple, what is the mean for the relevant peer group? For each multiple, what is the 75th percentile for the relevant peer group? EV/EBITDA EV/EBIT EV/Revenue P/E P/B For each multiple, what is the estimated share price for Trevor Pharmaceuticals based on a peer multiple computed from the 25th percentile for the relevant peer group? For each multiple, what is the estimated share price for Trevor Pharmaceuticals based on a peer multiple computed from the median for the relevant peer group? For each multiple, what is the estimated share price for Trevor Pharmaceuticals based on a peer multiple computed from the mean for the relevant peer group? For each multiple, what is the estimated share price for Trevor Pharmaceuticals based on a peer multiple computed from the 75th percentile for the relevant peer group? T


