

Answered step by step
Verified Expert Solution
Question
1 Approved Answer
The first tool I used to predict is called Sensitivity Analysis. Sensitivity Analysis involves to how different sources of uncertainty in a mathematical model help
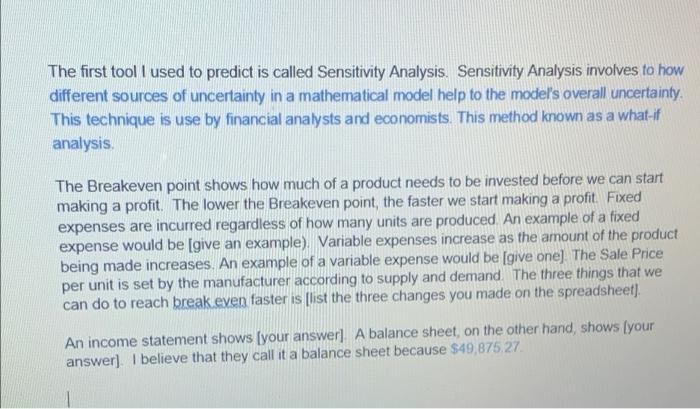
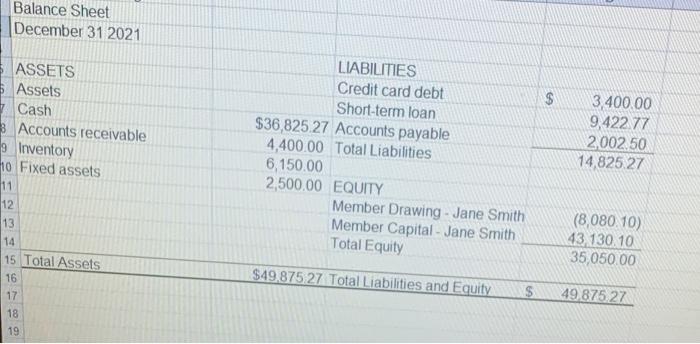
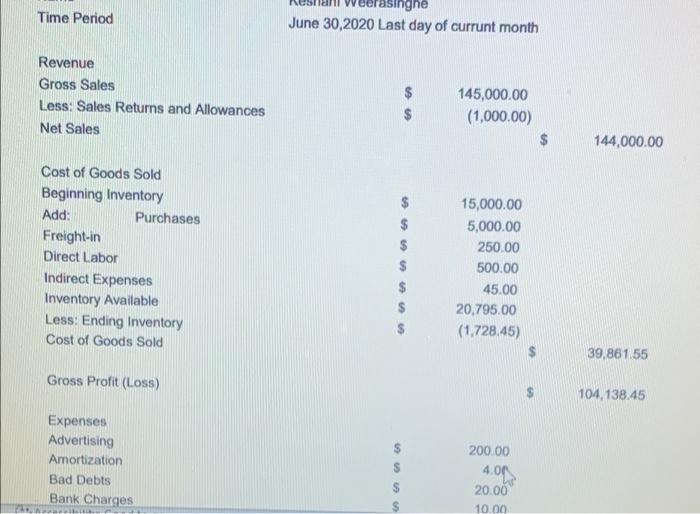
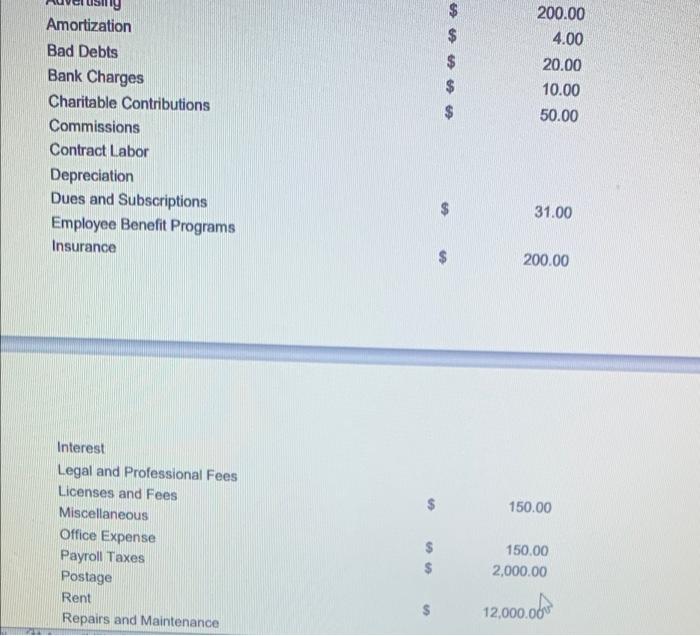
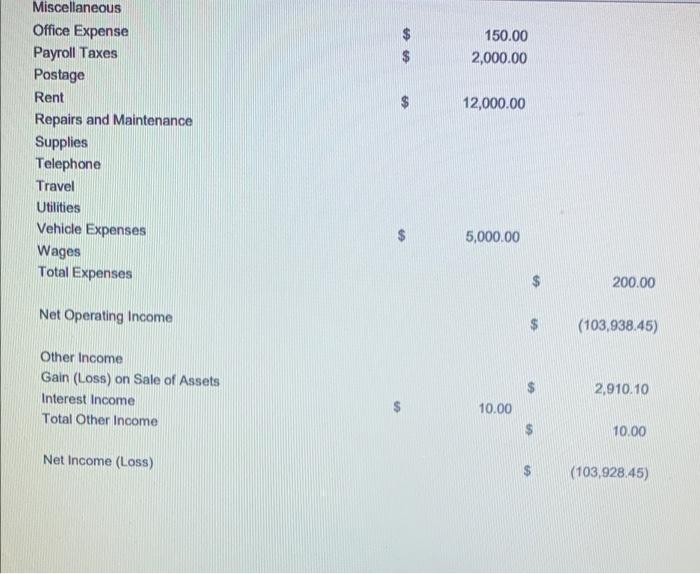 The first tool I used to predict is called Sensitivity Analysis. Sensitivity Analysis involves to how different sources of uncertainty in a mathematical model help to the model's overall uncertainty This technique is use by financial analysts and economists. This method known as a what-if analysis The Breakeven point shows how much of a product needs to be invested before we can start making a profit. The lower the Breakeven point, the faster we start making a profit. Fixed expenses are incurred regardless of how many units are produced An example of a fixed expense would be give an example) Variable expenses increase as the amount of the product being made increases. An example of a variable expense would be give one] The Sale Price per unit is set by the manufacturer according to supply and demand The three things that we can do to reach break even faster is [list the three changes you made on the spreadsheet). An income statement shows [your answer] A balance sheet, on the other hand, shows [your answer]. I believe that they call it a balance sheet because $49,875,27 Balance Sheet December 31 2021 $ ASSETS Assets Cash 3 Accounts receivable 9 Inventory 10 Fixed assets LIABILITIES Credit card debt Short-term loan $36,825 27 Accounts payable 4,400.00 Total Liabilities 6,150.00 2,500.00 EQUITY Member Drawing - Jane Smith Member Capital - Jane Smith Total Equity 3,400.00 9,422.77 2002.50 14,825 27 12 13 14 (8,080.10) 43.130.10 35,050.00 15 Total Assets $49,875,27 Total Liabilities and Equity $ 49.875 27 16 17 18 19 Time Period rasinghe June 30,2020 Last day of currunt month Revenue Gross Sales Less: Sales Returns and Allowances Net Sales 145,000.00 (1,000.00) 144,000.00 Cost of Goods Sold Beginning Inventory Add: Purchases Freight-in Direct Labor Indirect Expenses Inventory Available Less: Ending Inventory Cost of Goods Sold > > 15,000.00 5,000.00 250.00 500.00 45.00 20.795.00 (1,728.45) 39,861.55 Gross Profit (Loss) 104, 138.45 Expenses Advertising Amortization Bad Debts Bank Charges > 200.00 4.00 20.00 10.00 200.00 4.00 20.00 10.00 50.00 $ Amortization Bad Debts Bank Charges Charitable Contributions Commissions Contract Labor Depreciation Dues and Subscriptions Employee Benefit Programs Insurance 31.00 200.00 $ 150.00 Interest Legal and Professional Fees Licenses and Fees Miscellaneous Office Expense Payroll Taxes Postage Rent Repairs and Maintenance $ $ 150.00 2,000.00 $ 12,000.00 150.00 2,000.00 12,000.00 Miscellaneous Office Expense Payroll Taxes Postage Rent Repairs and Maintenance Supplies Telephone Travel Utilities Vehicle Expenses Wages Total Expenses 5,000.00 200.00 Net Operating Income (103,938.45) Other Income Gain (Loss) on Sale of Assets Interest Income Total Other Income 2,910.10 10.00 $ 10.00 Net Income (Loss) (103,928.45) The first tool I used to predict is called Sensitivity Analysis. Sensitivity Analysis involves to how different sources of uncertainty in a mathematical model help to the model's overall uncertainty This technique is use by financial analysts and economists. This method known as a what-if analysis The Breakeven point shows how much of a product needs to be invested before we can start making a profit. The lower the Breakeven point, the faster we start making a profit. Fixed expenses are incurred regardless of how many units are produced An example of a fixed expense would be give an example) Variable expenses increase as the amount of the product being made increases. An example of a variable expense would be give one] The Sale Price per unit is set by the manufacturer according to supply and demand The three things that we can do to reach break even faster is [list the three changes you made on the spreadsheet). An income statement shows [your answer] A balance sheet, on the other hand, shows [your answer]. I believe that they call it a balance sheet because $49,875,27 Balance Sheet December 31 2021 $ ASSETS Assets Cash 3 Accounts receivable 9 Inventory 10 Fixed assets LIABILITIES Credit card debt Short-term loan $36,825 27 Accounts payable 4,400.00 Total Liabilities 6,150.00 2,500.00 EQUITY Member Drawing - Jane Smith Member Capital - Jane Smith Total Equity 3,400.00 9,422.77 2002.50 14,825 27 12 13 14 (8,080.10) 43.130.10 35,050.00 15 Total Assets $49,875,27 Total Liabilities and Equity $ 49.875 27 16 17 18 19 Time Period rasinghe June 30,2020 Last day of currunt month Revenue Gross Sales Less: Sales Returns and Allowances Net Sales 145,000.00 (1,000.00) 144,000.00 Cost of Goods Sold Beginning Inventory Add: Purchases Freight-in Direct Labor Indirect Expenses Inventory Available Less: Ending Inventory Cost of Goods Sold > > 15,000.00 5,000.00 250.00 500.00 45.00 20.795.00 (1,728.45) 39,861.55 Gross Profit (Loss) 104, 138.45 Expenses Advertising Amortization Bad Debts Bank Charges > 200.00 4.00 20.00 10.00 200.00 4.00 20.00 10.00 50.00 $ Amortization Bad Debts Bank Charges Charitable Contributions Commissions Contract Labor Depreciation Dues and Subscriptions Employee Benefit Programs Insurance 31.00 200.00 $ 150.00 Interest Legal and Professional Fees Licenses and Fees Miscellaneous Office Expense Payroll Taxes Postage Rent Repairs and Maintenance $ $ 150.00 2,000.00 $ 12,000.00 150.00 2,000.00 12,000.00 Miscellaneous Office Expense Payroll Taxes Postage Rent Repairs and Maintenance Supplies Telephone Travel Utilities Vehicle Expenses Wages Total Expenses 5,000.00 200.00 Net Operating Income (103,938.45) Other Income Gain (Loss) on Sale of Assets Interest Income Total Other Income 2,910.10 10.00 $ 10.00 Net Income (Loss) (103,928.45)
Step by Step Solution
There are 3 Steps involved in it
Step: 1

Get Instant Access to Expert-Tailored Solutions
See step-by-step solutions with expert insights and AI powered tools for academic success
Step: 2

Step: 3
Ace Your Homework with AI
Get the answers you need in no time with our AI-driven, step-by-step assistance
Get Started
Financial management theory and practice
Authors: Eugene F. Brigham and Michael C. Ehrhardt
13th edition
1439078106, 111197375X, 9781439078105, 9781111973759, 978-1439078099