

Question
The first two charts are my measurements and calculation of densities and deviations for water and 70% Isopropyl alcohol. The third picture is the question.
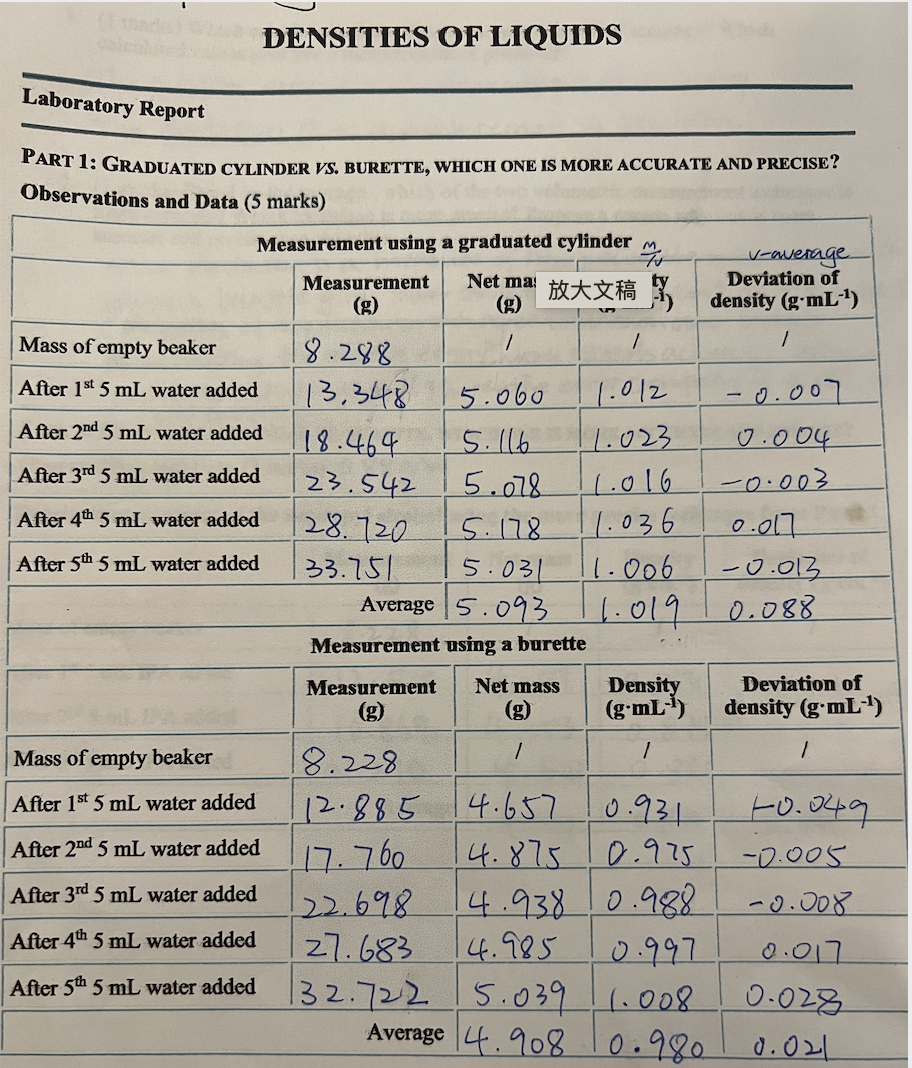
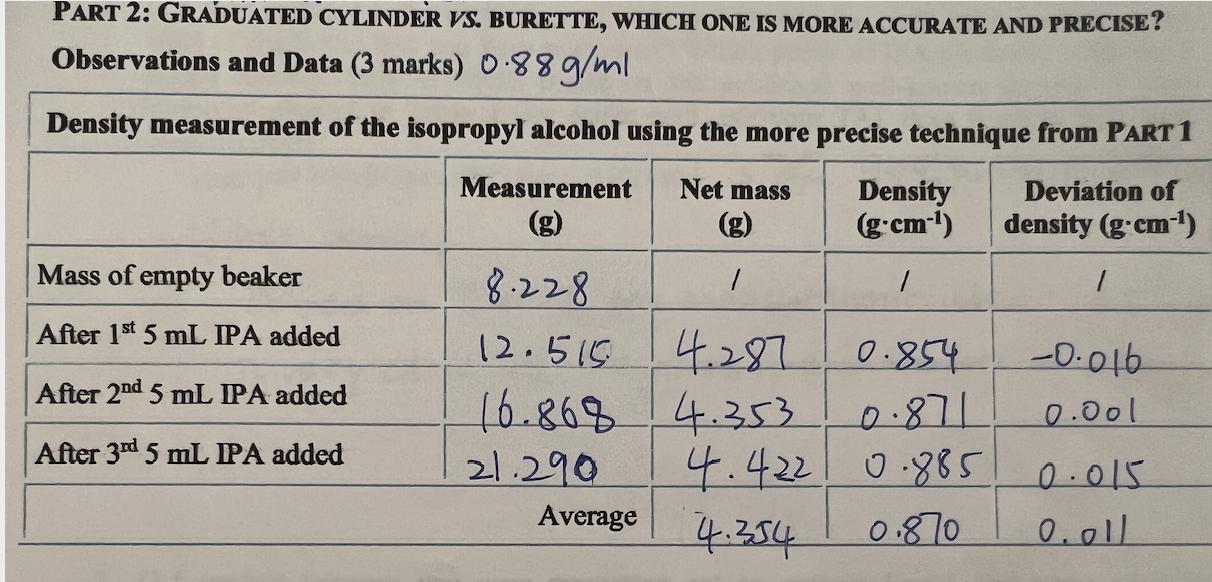
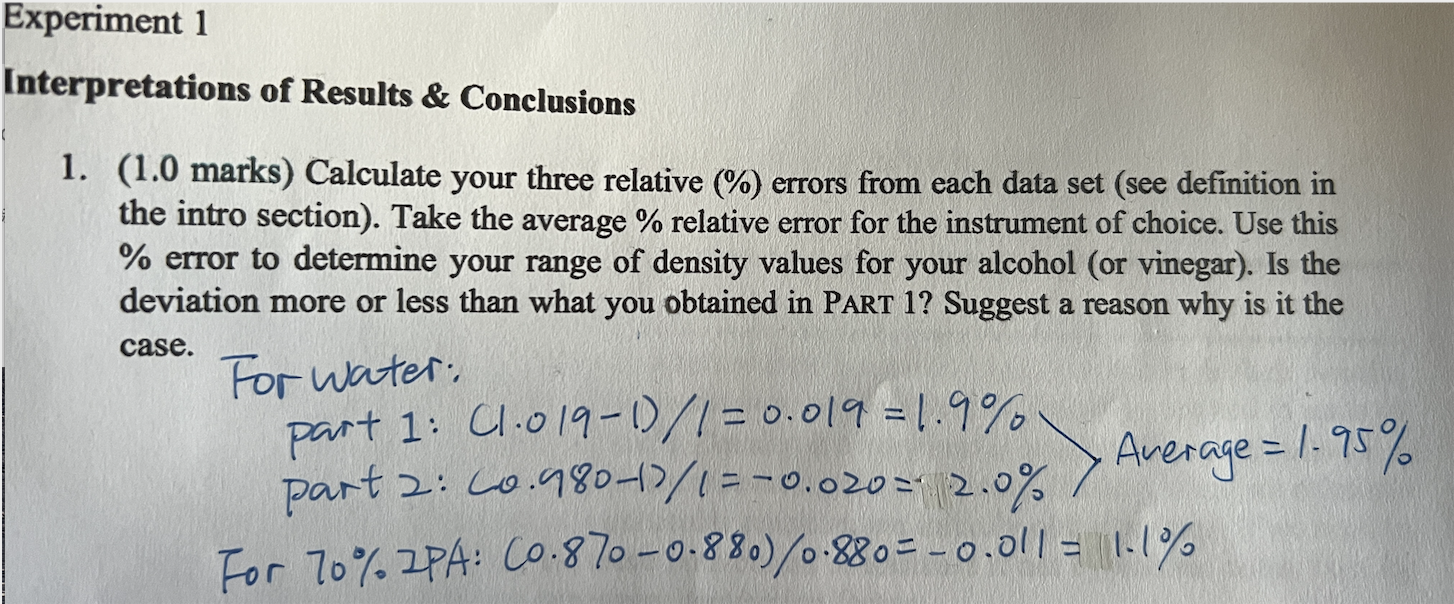
The first two charts are my measurements and calculation of densities and deviations for water and 70% Isopropyl alcohol. The third picture is the question. I have calculated the relative errors but still confuse with " Use this % error to determine your range of density values for your alcohol. Is the deviation more or less than what you obtained in Part 1? Suggest a reason why is it the case." Please help! Thank you!
DENSITIES OF LIQUIDS Laboratory Report Net may PART 1: GRADUATED CYLINDER VS. BURETTE, WHICH ONE IS MORE ACCURATE AND PRECISE? Observations and Data (5 marks) Measurement using a graduated cylinderm v-average Measurement Deviation of (g) density (g.mL-1) Mass of empty beaker 1 / / 18.288 After 1st 5 mL water added 13,348 5.060 1.012 0.007 After 2nd 5 mL water added 18.464 5.116 1.023 0.004 After 3rd 5 mL water added 23.542 5.078 11.016 -0.003 After 4th 5 mL water added 128.720 5.178 11.036 0.017 After 5th 5 mL water added 33.751 5.031 11.006 -0.013 Average 5.093. 1.019 0.088 Measurement using a burette Measurement Net mass Density Deviation of (g.mL-1) density (g.mL-) 1 / 1 Mass of empty beaker 18.228 After 1st 5 mL water added 12.885 4.657 0.931 +0.049 After 2nd 5 mL water added 4.875 0.975 -0.005 After 3rd 5 mL water added 122.698 4.938 0.988 -0.008 After 4th 5 mL water added 27.683 0.997 0.017 After 5th 5 mL water added 132.722 15.039 1.008 0.028 Average 4.908 0.980 0.021 17.760 14.985 PART 2: GRADUATED CYLINDER VS. BURETTE, WHICH ONE IS MORE ACCURATE AND PRECISE? Observations and Data (3 marks) 0.88 g/ml Density measurement of the isopropyl alcohol using the more precise technique from PART 1 Measurement Net mass Density Deviation of (g:cm-1) density (g'cm-1) Mass of empty beaker 8.228 After 1st 5 mL IPA added 12.516 4.287 0.854 -0.016 After 2nd 5 mL IPA added 16.868 4.353 0.00| After 3rd 5 mL PA added 21.290 4.4221 0.885 0.015 Average 4.354 0.870 0.01 0.871 Experiment 1 Interpretations of Results & Conclusions case. 1. (1.0 marks) Calculate your three relative (%) errors from each data set (see definition in the intro section). Take the average % relative error for the instrument of choice. Use this % error to determine your range of density values for your alcohol (or vinegar). Is the deviation more or less than what you obtained in PART 1? Suggest a reason why is it the For water: part 1: (1.019-0/1 = 0.019 = 1.9% part 2: 10.980-19/1=-0.020 =- 2,0% Average = 1.95% For 70%.ZPA: C0.870-0.880)/0-880= -0.011 = 11%Step by Step Solution
There are 3 Steps involved in it
Step: 1

Get Instant Access to Expert-Tailored Solutions
See step-by-step solutions with expert insights and AI powered tools for academic success
Step: 2

Step: 3
Ace Your Homework with AI
Get the answers you need in no time with our AI-driven, step-by-step assistance
Get Started
Introduction To Chemical Engineering Tools For Today And Tomorrow
Authors: Kenneth A. Solen, John N. Harb
5th Edition
0470885726, 978-0470885727