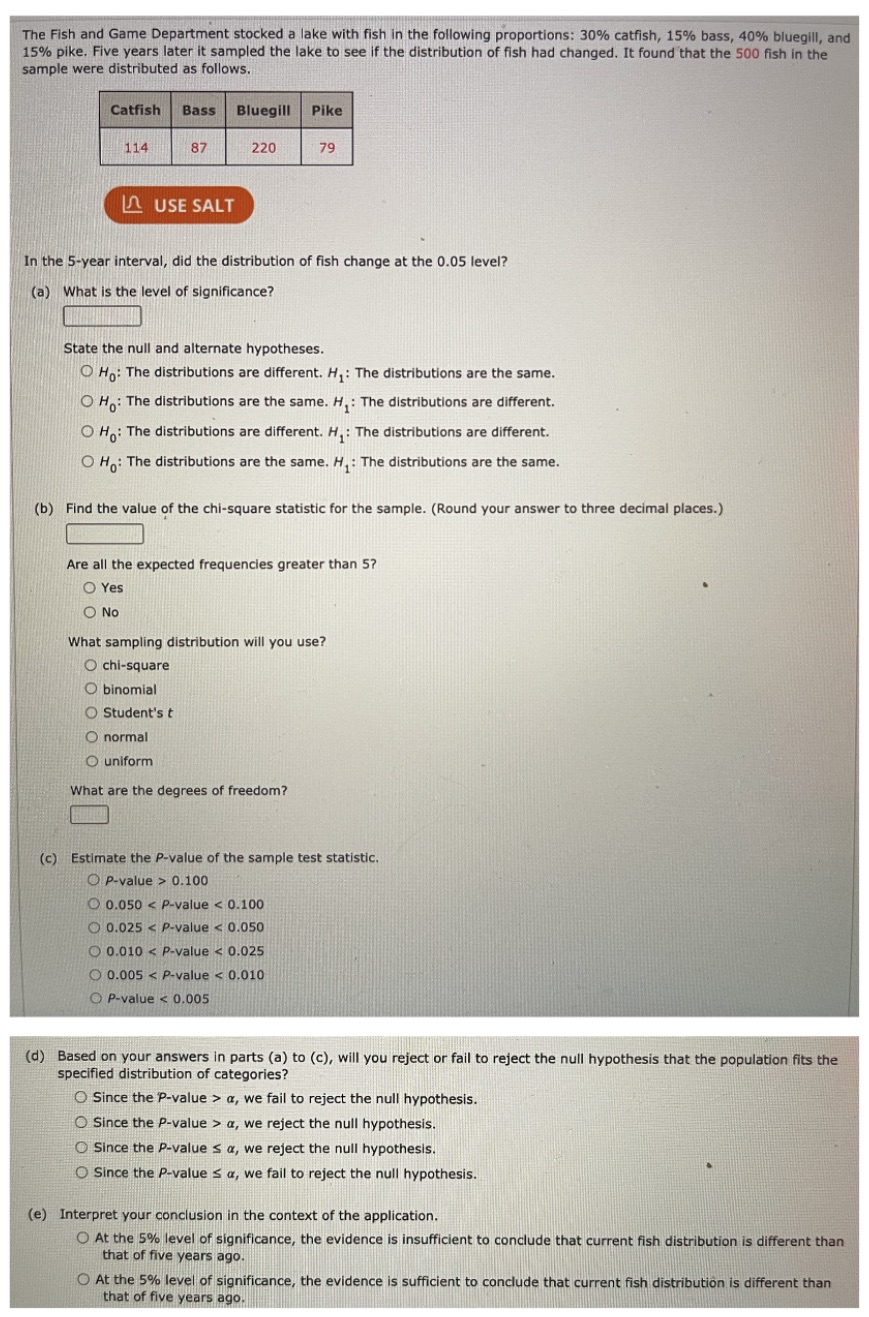
The Fish and Game Department stocked a lake with fish in the following proportions: 30% catfish, 15% bass, 40% bluegill, and 15% pike. Five years later it sampled the lake to see if the distribution of fish had changed. It found that the 500 fish in the sample were distributed as follows. Catfish Bass Bluegill Pike 114 87 220 79 In USE SALT In the 5-year interval, did the distribution of fish change at the 0.05 level? (a) What is the level of significance? State the null and alternate hypotheses. O Ho: The distributions are different. H, : The distributions are the same. O Ho: The distributions are the same. H, : The distributions are different. O Ho: The distributions are different. H. : The distributions are different. O Ho: The distributions are the same. H, : The distributions are the same. (b) Find the value of the chi-square statistic for the sample. (Round your answer to three decimal places.) Are all the expected frequencies greater than 5? Yes O No What sampling distribution will you use? O chi-square O binomial O Student's t O normal O uniform What are the degrees of freedom? (c) Estimate the P-value of the sample test statistic. OP-value > 0.100 O 0.050 a, we fail to reject the null hypothesis. O Since the P-value > a, we reject the null hypothesis. O Since the P-value s a, we reject the null hypothesis. O Since the P-value s a, we fail to reject the null hypothesis. (e) Interpret your conclusion in the context of the application. O At the 5% level of significance, the evidence is insufficient to conclude that current fish distribution is different than that of five years ago. O At the 5% level of significance, the evidence is sufficient to conclude that current fish distribution is different than that of five years ago