Answered step by step
Verified Expert Solution
Question
1 Approved Answer
The following accounting events affected Vernon Manufacturing Company during its first three years of operation. Ass transactions are cash transactions. Transactions for Year 1 1.
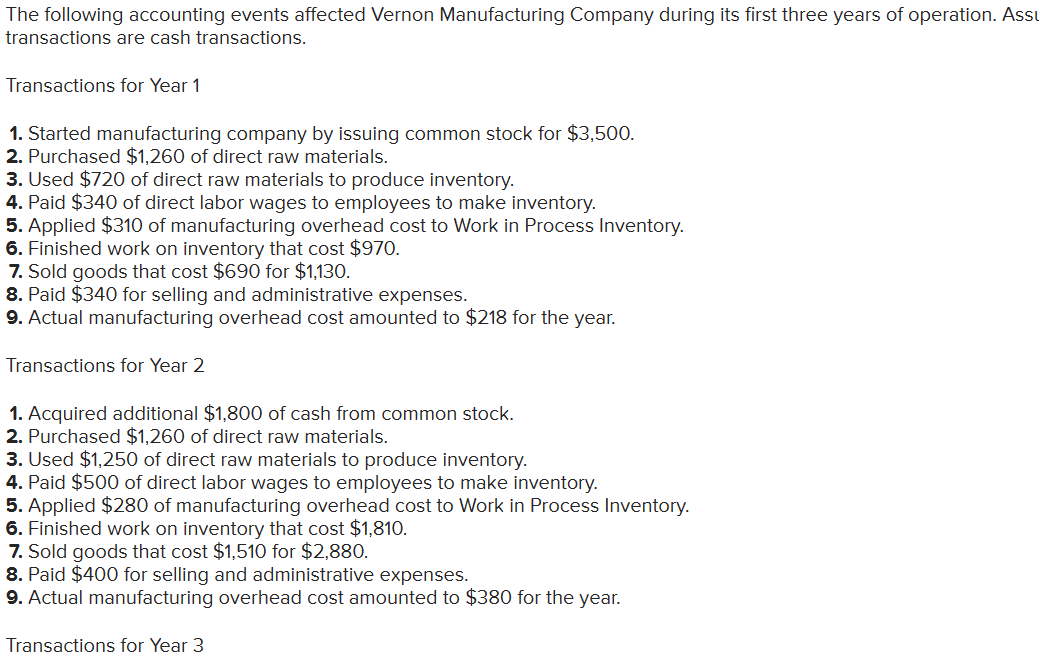

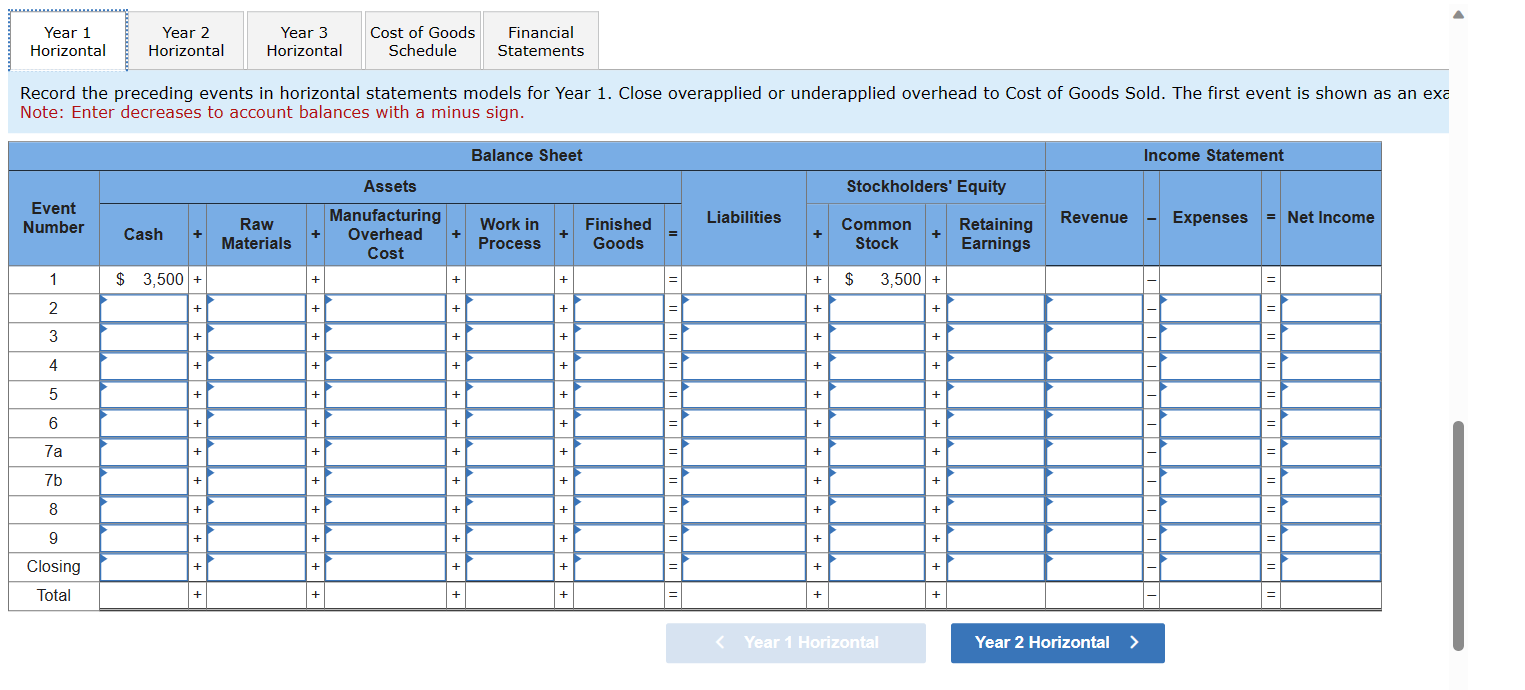
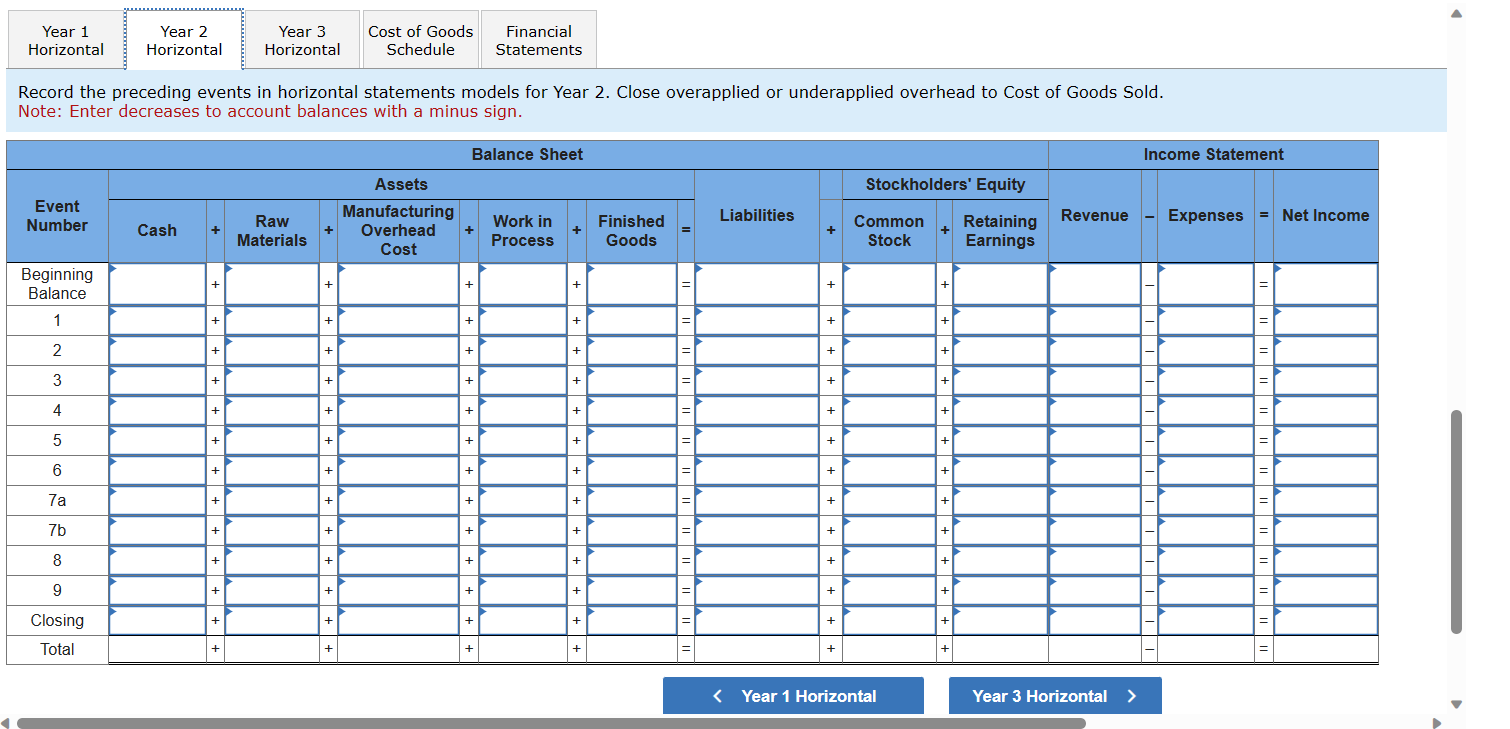
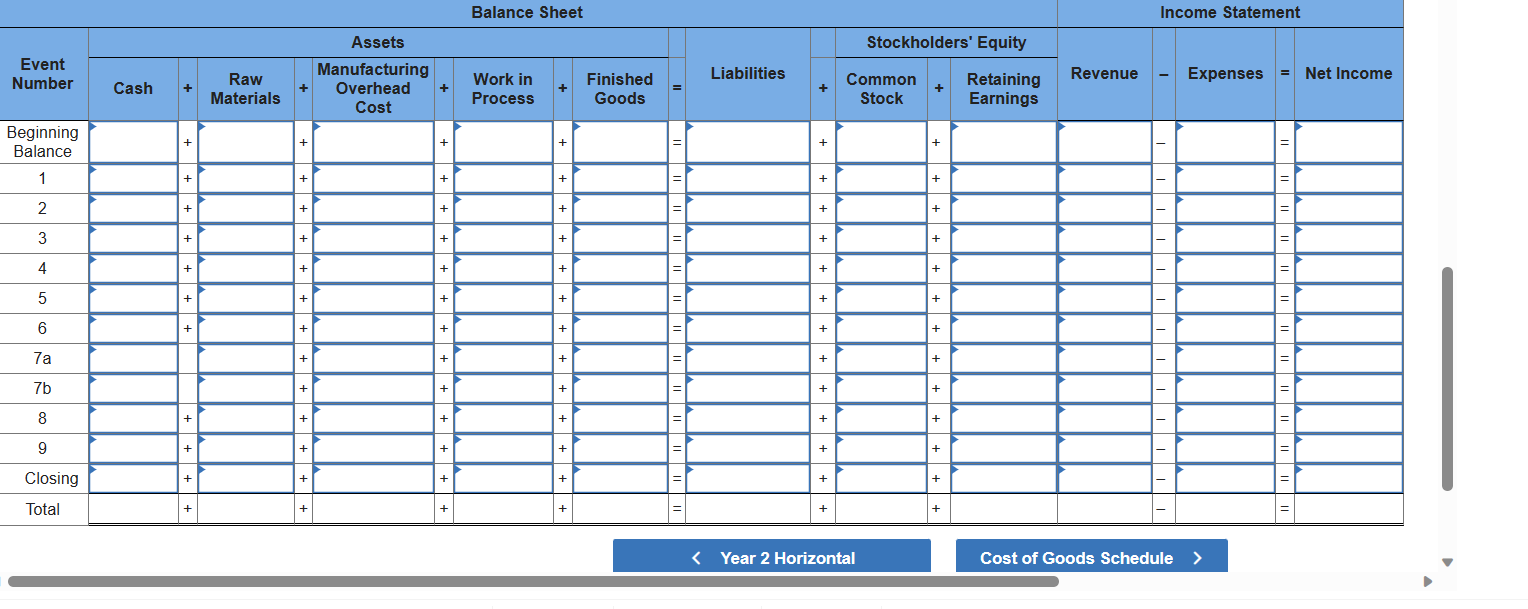
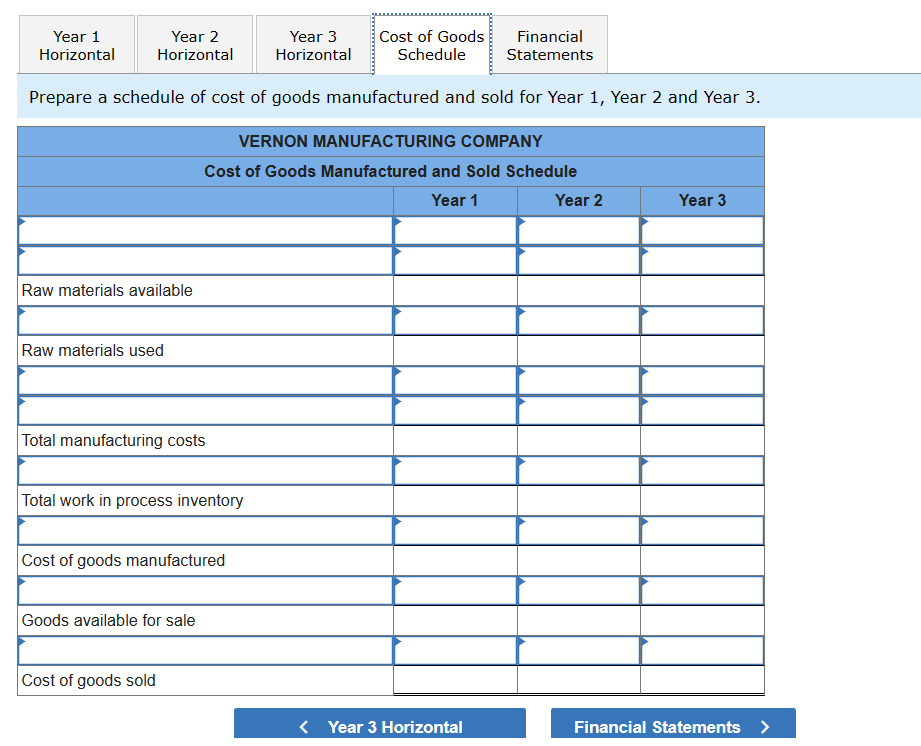
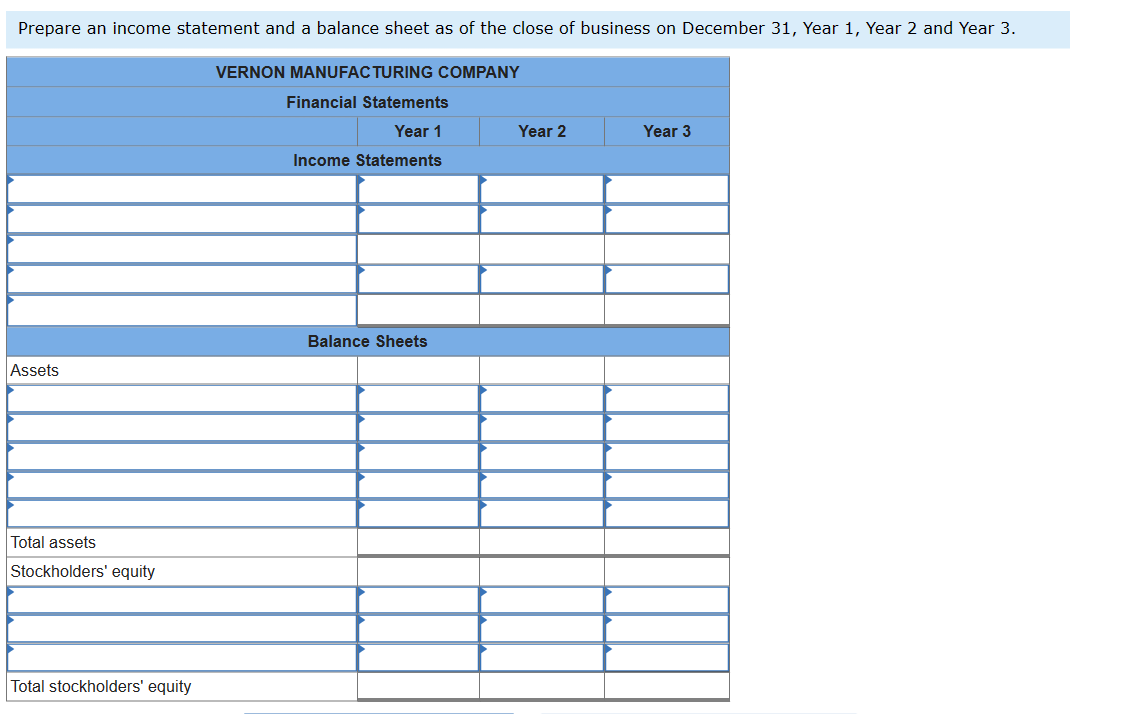 The following accounting events affected Vernon Manufacturing Company during its first three years of operation. Ass transactions are cash transactions. Transactions for Year 1 1. Started manufacturing company by issuing common stock for $3,500. 2. Purchased $1,260 of direct raw materials. 3. Used $720 of direct raw materials to produce inventory. 4. Paid $340 of direct labor wages to employees to make inventory. 5. Applied $310 of manufacturing overhead cost to Work in Process Inventory. 6. Finished work on inventory that cost $970. 7. Sold goods that cost $690 for $1,130. 8. Paid $340 for selling and administrative expenses. 9. Actual manufacturing overhead cost amounted to $218 for the year. Transactions for Year 2 1. Acquired additional $1,800 of cash from common stock. 2. Purchased $1,260 of direct raw materials. 3. Used $1,250 of direct raw materials to produce inventory. 4. Paid $500 of direct labor wages to employees to make inventory. 5. Applied $280 of manufacturing overhead cost to Work in Process Inventory. 6. Finished work on inventory that cost $1,810. 7. Sold goods that cost $1,510 for $2,880. 8. Paid $400 for selling and administrative expenses. 9. Actual manufacturing overhead cost amounted to $380 for the year. Transactions for Year 3 1. Paid a cash dividend of $800. 2. Purchased $1,400 of direct raw materials. 3. Used $1,200 of direct raw materials to produce inventory. 4. Paid $410 of direct labor wages to employees to make inventory. 5. Applied $330 of manufacturing overhead cost to work in process. 6. Finished work on inventory that cost $2,040. 7. Sold goods that cost $2,240 for $3,540. 8. Paid $650 for selling and administrative expenses. 9. Annual manufacturing overhead costs were $240 for the year. Required a.c.\&d. Record the preceding events in horizontal statements models for each of the three years. Close overapplied or underapplied overhead to Cost of Goods Sold. In Year 1, the first event is shown as an example. b.\&d. Prepare a schedule of cost of goods manufactured and sold, an income statement, and a balance sheet as of the close of business on December 31, Year 1, Year 2 and Year 3. \begin{tabular}{|c|c|c|c|c|c|c|c|c|c|c|c|c|c|c|c|c|c|c|c|c|c|c|c|} \hline \multicolumn{2}{|c|}{\begin{tabular}{c} Year 1 \\ Horizontal \end{tabular}} & \multicolumn{3}{|c|}{\begin{tabular}{c} Year 2 \\ Horizontal \end{tabular}} & \multicolumn{3}{|c|}{\begin{tabular}{c} Year 3 \\ Horizontal \end{tabular}} & \multicolumn{2}{|c|}{\begin{tabular}{c} Cost of Goods \\ Schedule \end{tabular}} & \multicolumn{2}{|c|}{\begin{tabular}{l} Financial \\ Statements \end{tabular}} & & & & & & & & & & & & \\ \hline \\ \hline \multicolumn{19}{|c|}{ Balance Sheet } & \multicolumn{5}{|c|}{ Income Statement } \\ \hline \multirow[b]{2}{*}{\begin{tabular}{c} Event \\ Number \end{tabular}} & \multicolumn{13}{|c|}{ Assets } & \multirow[b]{2}{*}{ Liabilities } & \multicolumn{4}{|c|}{ Stockholders' Equity } & \multirow[b]{2}{*}{ Revenue } & \multirow[b]{2}{*}{-} & \multirow[b]{2}{*}{ Expenses } & \multirow[b]{2}{*}{=} & \multirow[b]{2}{*}{ Net Income } \\ \hline & & ash & + & & \begin{tabular}{l} aw \\ erials \end{tabular} & + & & \begin{tabular}{l} hufacturing \\ verhead \\ Cost \end{tabular} & + & \begin{tabular}{l} Work in \\ Process \end{tabular} & + & \begin{tabular}{l} Finished \\ Goods \end{tabular} & = & & + & \begin{tabular}{c} Common \\ Stock \end{tabular} & + & \begin{tabular}{c} Retaining \\ Earnings \end{tabular} & & & & & \\ \hline 1 & $ & 3,500 & + & & & + & & & + & & + & & = & & + & $3,500 & + & & & - & & = & \\ \hline 2 & F & & + & & & + & & & + & & + & & = & & + & & + & & & -3 & & = & \\ \hline 3 & L & & + & & & + & & & + & & + & & = & & + & & + & & & - & & = & \\ \hline 4 & & & + & & & + & & & + & & + & & = & & + & & + & & 7 & - & & = & \\ \hline 5 & & & + & & & + & & & + & & + & & = & & + & & + & & 7 & - & & = & \\ \hline 6 & & & + & & & + & & & + & & + & & = & & + & & + & & 7 & - & & = & \\ \hline 7a & 5 & & + & & & + & & & + & & + & & = & & + & & + & & & - & & = & \\ \hline 7b & & & + & & & + & & & + & & + & & = & & + & & + & & & - & & = & \\ \hline 8 & & & + & & & + & & & + & & + & & = & & + & & + & & & - & & = & \\ \hline 9 & 5 & & + & & & + & & & + & & + & & = & & + & & + & & 7 & - & & = & \\ \hline Closing & & & + & & & + & & & + & & + & & = & & + & & + & & & - & & = & \\ \hline Total & & & + & & & + & & & + & & + & & = & & + & & + & & & - & & = & \\ \hline \end{tabular} Year 1 Horizontal Year 2 Horizontal Record the preceding events in horizontal statements models for Year 2. Close overapplied or underapplied overhead to Cost of Goods Sold. Note: Enter decreases to account balances with a minus sign. \begin{tabular}{|c|c|c|c|c|c|c|c|c|c|c|c|c|c|c|c|c|c|c|} \hline \multirow[b]{2}{*}{\begin{tabular}{l} Event \\ Number \end{tabular}} & \multicolumn{9}{|c|}{ Assets } & \multirow[b]{2}{*}{ Liabilities } & \multicolumn{4}{|c|}{ Stockholders' Equity } & \multirow[b]{2}{*}{ Revenue } & & \multirow[b]{2}{*}{ Expenses } & \multirow[b]{2}{*}{= Net Income } \\ \hline & Cash & + & \begin{tabular}{c} Raw \\ Materials \end{tabular} & + & \begin{tabular}{l} Manufacturing \\ Overhead \\ Cost \end{tabular} & & \begin{tabular}{l} Work in \\ Process \end{tabular} & + & \begin{tabular}{l} Finished \\ Goods \end{tabular} & & & \begin{tabular}{c} Common \\ Stock \end{tabular} & + & \begin{tabular}{l} Retaining \\ Earnings \end{tabular} & & -1 & & \\ \hline \begin{tabular}{l} Beginning \\ Balance \end{tabular} & & + & & + & & + & & + & & & + & & + & & & - & & \\ \hline 1 & & + & & + & & + & & & & 1=1 & + & & + & & & - & & = \\ \hline 2 & & + & & + & & + & & & & 1=1 & + & & + & & & - & & = \\ \hline 3 & & + & & + & & +1 & & & & =1 & + & & + & & & - & & = \\ \hline 4 & & + & & + & & + & & & & = & + & & + & & & - & & = \\ \hline 5 & & + & & + & & + & & & & 1=1 & + & & + & & & - & & =1 \\ \hline 6 & & + & & + & & + & & & & 1=1 & + & & + & & & - & & = \\ \hline 7a & & E & & + & & +1 & & & & =1 & + & & + & & & - & & = \\ \hline 7b & & & & + & & + & & & & 1 & + & & + & & & - & & =1 \\ \hline 8 & & + & & + & & + & & & & = & + & & + & & & - & & =1 \\ \hline 9 & & + & & + & & +1 & & & & =1 & + & & + & & & - & & = \\ \hline Closing & & + & & + & & & & & & =1 & + & & + & & & - & & = \\ \hline Total & & + & & + & & & & & & = & + & & + & & & - & & = \\ \hline \end{tabular} Prepare a schedule of cost of goods manufactured and sold for Year 1, Year 2 and Year 3 Prepare an income statement and a balance sheet as of the close of business on December 31, Year 1, Year 2 and Year 3. VERNON MANUFACTURING COMPANY \begin{tabular}{|c|c|c|c|} \hline \multicolumn{4}{|c|}{ Financial Statements } \\ \hline & Year 1 & Year 2 & Year 3 \\ \hline \multicolumn{4}{|c|}{ Income Statements } \\ \hline? & & & \\ \hline & & & \\ \hline & & & \\ \hline & & & \\ \hline & & & \\ \hline \multicolumn{4}{|c|}{ Balance Sheets } \\ \hline \multicolumn{4}{|l|}{ Assets } \\ \hline & & & \\ \hline \\ \hline & & & \\ \hline \multicolumn{4}{|l|}{5} \\ \hline & & & \\ \hline \multicolumn{4}{|l|}{ Total assets } \\ \hline \multicolumn{4}{|l|}{ Stockholders' equity } \\ \hline & & & \\ \hline 5 & & & \\ \hline & & & \\ \hline Total stockholders' equity & & & \\ \hline \end{tabular}
 Step by Step Solution
There are 3 Steps involved in it
Step: 1

Get Instant Access to Expert-Tailored Solutions
See step-by-step solutions with expert insights and AI powered tools for academic success
Step: 2

Step: 3

Ace Your Homework with AI
Get the answers you need in no time with our AI-driven, step-by-step assistance
Get Started


