Answered step by step
Verified Expert Solution
Link Copied!

Question

1 Approved Answer

The following annual excess rates of return (%) were obtained for nine individual stocks and a market index: Perform the first-pass regressions and tabulate the
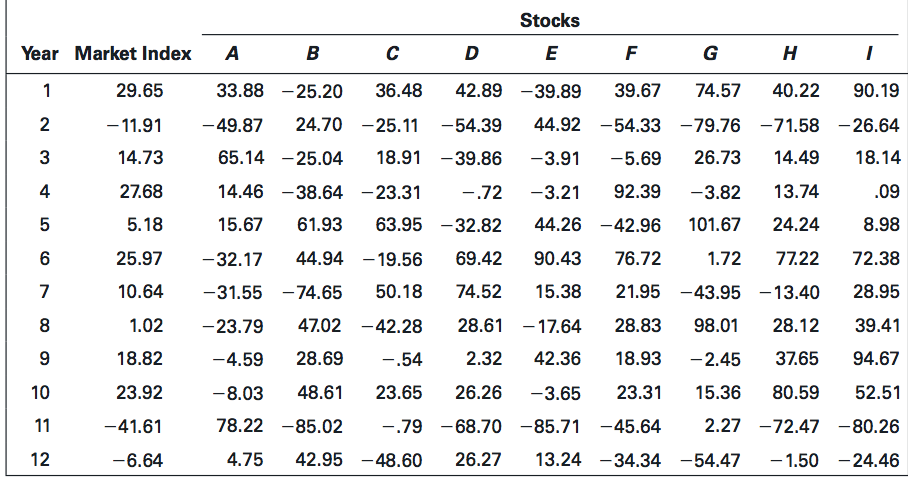
The following annual excess rates of return (%) were obtained for nine individual stocks and a market index:image text in transcribed

  1. Perform the first-pass regressions and tabulate the summary statistics.

  2. Specify the hypotheses for a test of the second-pass regression for the SML.

  3. Perform the second-pass SML regression by regressing the average excess return of each portfolio on its beta.

  4. Summarize your test results and compare them to the reported results in the text.

  5. Group the nine stocks into three portfolios, maximizing the dispersion of the betas of the three

    resultant portfolios. Repeat the test and explain any changes in the results.

  6. Explain Rolls critique as it applies to the tests performed in problems 3 to 7.

  7. Plot the capital market line (CML), the nine stocks, and the three portfolios on a graph of average returns versus standard deviation. Compare the mean-variance efficiency of the three portfolios and the market index. Does the comparison support the CAPM?

Stocks E Year Market Index A B D F G H 1 29.65 33.88 -25.20 36.48 42.89 -39.89 39.67 74.57 40.22 90.19 - 11.91 N 3 14.73 4 27.68 5 5.18 CO 25.97 7 10.64 -49.87 24.70 -25.11 -54.39 44.92 -54.33 -79.76 -71.58 -26.64 65.14 -25.04 18.91 -39.86 -3.91 -5.69 26.73 14.49 18.14 14.46 -38.64 -23.31 -.72 -3.21 92.39 -3.82 13.74 .09 15.67 61.93 63.95 -32.82 44.26 -42.96 101.67 24.24 8.98 -32.17 44.94 -19.56 69.42 90.43 76.72 1.72 77.22 72.38 -31.55 - 74.65 50.18 74.52 15.38 21.95 -43.95 -13.40 28.95 -23.79 47.02 -42.28 28.61 -17.64 28.83 98.01 28.12 39.41 -4.59 28.69 -.54 2.32 42.36 18.93 -2.45 37.65 94.67 -8.03 48.61 23.65 26.26 -3.65 23.31 15.36 80.59 52.51 78.22 -85.02 -.79 - 68.70 -85.71 -45.64 2.27 -72.47 -80.26 4.75 42.95 -48.60 26.27 13.24 -34.34 -54.47 -1.50 -24.46 8 1.02 18.82 9 10 23.92 11 -41.61 12 -6.64 Stocks E Year Market Index A B D F G H 1 29.65 33.88 -25.20 36.48 42.89 -39.89 39.67 74.57 40.22 90.19 - 11.91 N 3 14.73 4 27.68 5 5.18 CO 25.97 7 10.64 -49.87 24.70 -25.11 -54.39 44.92 -54.33 -79.76 -71.58 -26.64 65.14 -25.04 18.91 -39.86 -3.91 -5.69 26.73 14.49 18.14 14.46 -38.64 -23.31 -.72 -3.21 92.39 -3.82 13.74 .09 15.67 61.93 63.95 -32.82 44.26 -42.96 101.67 24.24 8.98 -32.17 44.94 -19.56 69.42 90.43 76.72 1.72 77.22 72.38 -31.55 - 74.65 50.18 74.52 15.38 21.95 -43.95 -13.40 28.95 -23.79 47.02 -42.28 28.61 -17.64 28.83 98.01 28.12 39.41 -4.59 28.69 -.54 2.32 42.36 18.93 -2.45 37.65 94.67 -8.03 48.61 23.65 26.26 -3.65 23.31 15.36 80.59 52.51 78.22 -85.02 -.79 - 68.70 -85.71 -45.64 2.27 -72.47 -80.26 4.75 42.95 -48.60 26.27 13.24 -34.34 -54.47 -1.50 -24.46 8 1.02 18.82 9 10 23.92 11 -41.61 12 -6.64

Step by Step Solution

There are 3 Steps involved in it

Step: 1

blur-text-image

Get Instant Access to Expert-Tailored Solutions

See step-by-step solutions with expert insights and AI powered tools for academic success

Step: 2

blur-text-image_2

Step: 3

blur-text-image_3

Ace Your Homework with AI

Get the answers you need in no time with our AI-driven, step-by-step assistance

Get Started

Recommended Textbook for

More Books

Students also viewed these Accounting questions