The following answers are wrong for this question! Please fill in correct answers! Thank you
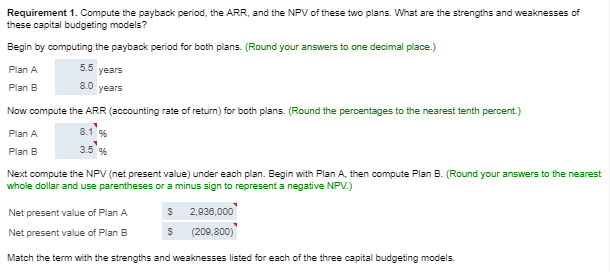
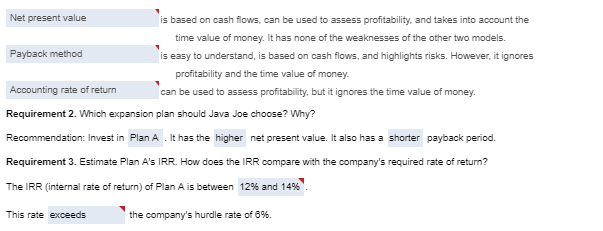
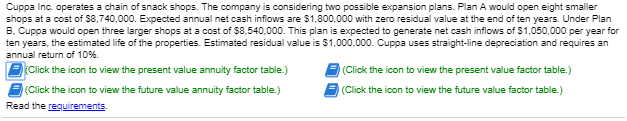
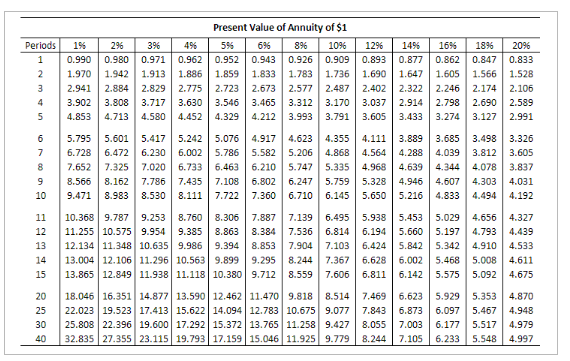
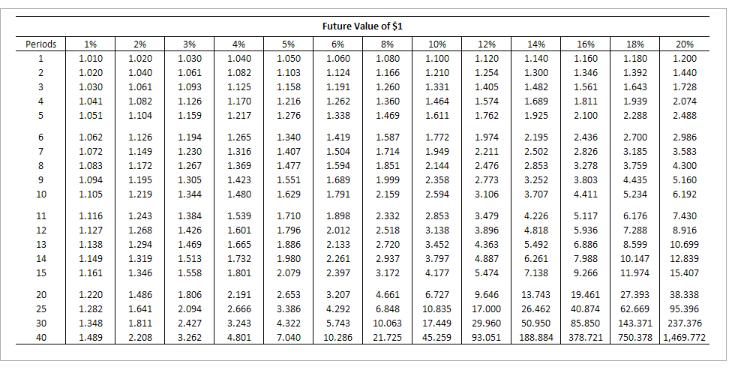
Cuppa Inc. operates a chain of snack shops. The company is considering two possible expansion plans. Plan A would open eight smaller shops at a cost of $8,740,000. Expected annual net cash inflows are $1,800,000 with zero residual value at the end of ten years. Under Plan B. Cuppa would open three larger shops at a cost of $8.540.000. This plan is expected to generate net cash inflows of $1,050,000 per year for ten years, the estimated life of the properties. Estimated residual value is $1.000.000. Cuppa uses straight-line depreciation and requires an annual return of 10%. Click the icon to view the present value annuity factor table.) 5(Click the icon to view the present value factor table.) (Click the icon to view the future value annuity factor table.) (Click the icon to view the future value factor table.) Read the requirements. Periods 1 0 2 1% .990 1.970 2.941 3.902 4.853 296 3% 0.980 0.971 1.942 1.913 2.884 2.829 3.808 3.717 4.7134.580 4% 0.962 1.886 2.775 3.630 4.452 Present Value of Annuity of $1 5% 6% 8% 10% 12% 0.9520 .943 0.926 0.9090 .893 1.859 1.833 1.783 1.736 1.690 2.723 2.673 2.577 2.487 2.402 3.546 3.465 3.312 3.170 3.037 4.329 4.212 3.993 3.791 3.605 14% 0.877 1.647 2.322 2.914 3.433 16% 0.862 1.605 2.246 2.798 3.274 18% 0.847 1.566 2.174 2.690 3.127 20% 0.833 1.528 2.106 2.589 2.991 3.498 3.812 4.078 4.303 4.494 3.326 3.605 3.837 4.031 4.192 5.795 5.601 5.417 5.242 5.076 4.917 4.623 4.355 4.111 3.889 3.685 6.728 6.472 6.230 6.002 5.786 5.582 5.206 4.868 4.564 4.288 4.039 7.652 7.3257.020 6.733 6.463 6.210 5.747 5.335 4.968 4.344 8.566 8.1627.786 7.435 7.108 6.802 6.247 5.759 5.328 4.946 4.607 9.471 8.983 8.530 8.111 7.722 7.360 6.710 6.145 5.650 5.216 4.833 10.368 9.787 9.2538.760 8.306 7.887 7.139 6.495 5.938 5.453 5.029 11.255 10.575 9.9549.3858.863 8.384 7.536 6.814 6.194 5.660 5.197 12.134 11.348 10.635 9.986 | 9.394 8.853 7.904 7.103 6.424 5.842 5.342 13.004 12.106 11.296 10.563 9.899 9.295 8.244 7.367 6.628 6.002 5.468 13.865 12.849 11.938 11.118 | 10.380 9.712 8.5597.606 6.811 6.142 5.575 18.046 16.351 14.877 13.590 12.462 11.470 9.818 8.514 7.4696.623 5.929 22.023 19.523 17.413 15.622 14.094 12.783 10.675 9.077 7.843 6.873 6.097 25.808 22.396 19.600 17.292 15.372 13.765 11.258 9.4278.055 | 7.0036.177 7.003 6.177 32.835 27.355 23.115 19.793 17.159 15.046 11.925 9.779 | 8.244 7.105 6.233 4.656 4.327 4.793 4.439 4.910 4.533 5.00B 4.611 5.092 4.675 5.353 4.870 5.467 4.948 5.517 4.979 5.548 | 4.997 Periods 1% 0.990 0.980 0.971 0.961 0.951 2% 3% 0.980 0.971 0.961 0.943 0.9420.915 0.924 0.888 0.906 0.863 4% 0.962 0.925 0.889 0.855 0.822 Present Value of $1 5% 6% 8% 10% 0.952 0.943 0.926 0.909 0.907 0.890 0.857 0.826 0.864 0.840 0.794 0.751 0.823 0.792 0.735 0.683 0.784 0.747 0.681 0.621 12% 0.893 0.797 0.712 0.636 0.567 14% 0.877 0.769 0.675 0.592 0.519 16% 0.862 0.743 0.641 0.552 0.476 0.942 0.933 0.923 0.914 0.905 0.789 0.888 0.837 0.871 0.813 0.853 0.837 0.766 0.820 0.744 0.804 0.722 0.701 0.790 0.760 0.731 0.703 0.676 0.746 0.711 0.677 0.645 0.614 18% 20% 0.847 0.833 0.7180.694 0.609 0.579 0.516 0.482 0.437 0.402 0.370 0.335 0.314 0.279 0.266 0.233 0.225 0.194 0.191 0.162 0.162 0.135 0.137 0.112 0.116 0.093 0.099 0.078 0.084 0.065 0.037 0.026 0.016 0.010 0.007 0.004 0.001 0.001 0.896 0.650 0.887 0.788 0.879 0.773 0.681 0.705 0.630 0.564 0.507 0.456 0.410 0.665 0.583 0.513 0.400 0.354 0.627 0.540 0.467 0.351 0.305 0.592 0.500 0.424 0.361 0.308 0.263 0.558 0.463 0.386 0.322 0.270 0.227 0.527 0.429 0.350 0.287 0.237 0.195 0.497 0.397 0.319 0.257 0.208 0.168 0.469 0.368 0.290 0.229 0.145 0.442 0.340 0.263 0.205 0.160 0.125 0.417 0.315 0.239 0.183 0.140 0.108 0.312 0.215 0.149 0.104 0.073 0.051 0.233 0.146 0.092 0.0590.038 0.024 0.174 0.099 0.057 0.033 0.020 0.012 0.097 0.046 0.022 0.0110.005 0.003 0.182 0.870 0.861 0.758 0.743 -625 1601 0.577 0.555 0.456 0.375 0.308 0.208 0.661 0.642 0.585 0.557 0.530 0.505 0.481 0.377 0.295 0.231 0.142 0.820 0.780 0.742 0.672 0.673 0.610 0.552 0.453 0.554 0.478 0.412 0.307 40 Periods 1% 1.000 2.010 3.030 4.060 5.101 2% 1.000 2.020 3.060 4.122 5.204 3% 1.000 2.030 3.091 4.184 5.309 4% 1.000 2.040 3.122 4.246 5.416 Future Value of Annuity of $1 5% 6% 8% 10% 1.000 1.000 1.000 11.000 2.050 2.060 2.080 2.100 3.153 3.184 3.246 3.310 4.310 4.375 4.506 4.641 5.526 5.637 5.867 6.105 12% 1.000 2.120 3.374 4.779 6.353 14% 1.000 2.140 3.440 4.921 6.610 16% 1.000 2.160 3.506 5.066 6.877 1896 1.000 2.180 3.572 5.215 7.154 20% 1.000 2.200 3.640 5.368 7.442 6.152 7.214 8.286 9.369 10.462 6.308 7.434 8.583 9.755 10.950 6.468 7.662 8.892 10.159 11.464 6.633 7.898 9.214 10.583 12.006 6.802 8.142 9.549 11.027 12.578 6.975 8.394 9.897 11.491 13.181 7.336 8.923 10.637 12.488 14.487 7.716 9.487 11.436 13.579 15.937 8.115 10.089 12.300 14.776 17.549 8.536 10.730 13.233 16.085 19.337 8.977 11.414 14.240 17.519 21.321 9.442 12.142 15.327 19.086 23.521 9.930 12.916 16.499 20.799 25.959 11.567 12.683 13.809 14.947 16.097 12.169 13.412 14.680 15.974 17.293 12.808 14.192 15.618 17.086 18.599 13.486 15.026 16.627 18.292 20.024 14.207 15.917 17.713 19.599 21.579 14.972 16.870 18.882 21.015 23.276 16.645 18.977 21.495 24.215 27.152 18.531 21.384 24.523 27.975 31.772 20.655 24.133 28.029 32.393 37.280 23.045 27.271 32.089 37.581 43.842 25.733 30.850 36.786 43.672 51.660 28.755 34.931 42.219 50.818 60.965 32.150 39.581 48.497 59.196 72.035 22.019 24.297 28.243 | 32.030 34.785 40.568 48.88660.402 26.870 36.459 47.575 75.401 29.778 41.646 56.085 95.026 33.066 47.727 66.439 120.800 36.786 54.865 79.058 154.762 45.762 73.106 113.283 259.057 57.275 72.052 91.025115.380 146.628 186.688 98.347 133.334 181.871 249.214 342.603471.981 164.494 241.333 356.787 530.312790.948 1,181.882 442.593767.091 1,342.025 2,360.757 4,163.213 7,343.858 Periods 1% 1.010 1.020 1.030 1.041 1.051 2% 1.020 1.040 1.061 1.082 1.104 3% 4% 5% 1.030 11.040 11.050 11.061 1.082 1.103 1.093 1.125 1.158 1.126 1.170 1.216 1.159 1.217 1.276 Future Value of $1 6% 8% 1.060 1.080 1.124 1.166 1.260 1.262 1.360 1.338 1.469 10% 1.100 1.210 1.331 1.464 1.611 12% 1.120 1.254 1.405 1.574 1.762 14% 1.140 1.300 1.482 1.689 1.925 16% 1.160 1.346 1.561 1.81 2.100 18% 1.180 1.392 1.643 1.939 2.290 20% 1.200 1.440 1.728 2.074 2.488 1.191 1.062 1.072 1.083 1.094 1.105 1.126 1.149 1.172 1.195 1.219 1.194 1.230 1.267 1.305 1.344 1.265 1.316 1.369 1.423 1.480 1.340 1.407 1.477 1.551 1.629 1.419 1.504 1.594 1.689 1.791 1.587 1.714 1.851 1.999 1.772 1.949 2.144 2.358 2.594 1.974 2.211 2.476 2.773 3.106 2.195 2.502 2.853 3.252 3.707 2.436 2.826 3.278 3.803 4.411 2.700 3.185 3.759 4.435 5.234 2.986 3.583 4.300 5.160 6.192 2.159 1.116 1.127 1.138 1.149 1.161 1.243 1.268 1.294 1.319 1.346 1.384 1.426 1.469 1.513 1.558 1.539 1.601 1.665 1.732 1.710 1.796 1.886 1.980 2.079 1.898 2.012 2.133 2.261 2.397 2.332 2.518 2.720 2.937 3.172 2.853 3.138 3.452 3.797 4.177 3.479 3.896 4.363 4.887 5.474 4.226 4.818 5.492 6.261 7.138 5.117 5.936 6.886 7.988 9.266 6.176 7.288 8.599 10.147 11.974 7.430 8.916 10.699 12.839 15.407 1.801 1.220 1.282 1.348 1.486 1.641 1.811 1.806 2.094 2.427 2.191 2.666 3.243 4.801 2.653 3.386 4.322 7.040 3.207 4.292 5.743 10.286 4.661 6.848 10.063 21.725 6.727 10.835 17.449 45.259 9.646 17.000 29.960 93.051 13.743 26.462 50.950 188.884 19.461 40.874 85.850 378.721 27.393 62.669 143.371 750.378 38.338 95.396 237.376 1,469.772 Requirement 1. Compute the payback period, the ARR, and the NPV of these two plans. What are the strengths and weaknesses of these capital budgeting models? Begin by computing the payback period for both plans. (Round your answers to one decimal place.) Plan A Plan B 5.5 years 8.0 years Now compute the ARR (accounting rate of return) for both plans. (Round the percentages to the nearest tenth percent.) Plan A Plan B 8.1 % 3.5 % Next compute the NPV (net present value) under each plan. Begin with Plan A then compute Plan B. (Round your answers to the nearest whole dollar and use parentheses or a minus sign to represent a negative NPV.) Net present value of Plan A $ S 2,936.000 (209.800) Net present value of Plan B Match the term with the strengths and weaknesses listed for each of the three capital budgeting models. Net present value Payback method is based on cash flows, can be used to assess profitability, and takes into account the time value of money. It has none of the weaknesses of the other two models. is easy to understand, is based on cash flows, and highlights risks. However, it ignores profitability and the time value of money can be used to assess profitability, but it ignores the time value of money. Accounting rate of return Requirement 2. Which expansion plan should Java Joe choose? Why? Recommendation: Invest in Plan A . It has the higher net present value. It also has a shorter payback period. Requirement 3. Estimate Plan A's IRR. How does the IRR compare with the company's required rate of return? The IRR (internal rate of return) of Plan A is between 12% and 14% This rate exceeds the company's hurdle rate of 8%