Answered step by step
Verified Expert Solution
Link Copied!

Question

1 Approved Answer

) The following are information about S&P 500 at the end of 2019, as well as some historical data. Please select relevant information to answer
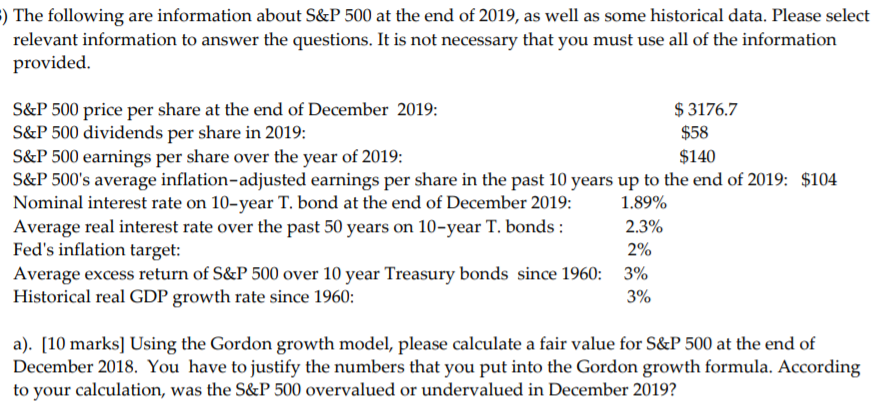
image text in transcribed

) The following are information about S&P 500 at the end of 2019, as well as some historical data. Please select relevant information to answer the questions. It is not necessary that you must use all of the information provided. S&P 500 price per share at the end of December 2019: $ 3176.7 S&P 500 dividends per share in 2019: $58 S&P 500 earnings per share over the year of 2019: $140 S&P 500's average inflation-adjusted earnings per share in the past 10 years up to the end of 2019: $104 Nominal interest rate on 10-year T. bond at the end of December 2019: 1.89% Average real interest rate over the past 50 years on 10-year T. bonds : 2.3% Fed's inflation target: Average excess return of S&P 500 over 10 year Treasury bonds since 1960: 3% Historical real GDP growth rate since 1960: 3% 2% a). [10 marks] Using the Gordon growth model, please calculate a fair value for S&P 500 at the end of December 2018. You have to justify the numbers that you put into the Gordon growth formula. According to your calculation, was the S&P 500 overvalued or undervalued in December 2019

Step by Step Solution

There are 3 Steps involved in it

Step: 1

blur-text-image

Get Instant Access to Expert-Tailored Solutions

See step-by-step solutions with expert insights and AI powered tools for academic success

Step: 2

blur-text-image_2

Step: 3

blur-text-image_3

Ace Your Homework with AI

Get the answers you need in no time with our AI-driven, step-by-step assistance

Get Started

Recommended Textbook for

Financial Economics

Authors: Zvi Bodie, Robert C Merton, David Cleeton

2nd Edition

0558785751, 9780558785758

More Books

Students also viewed these Finance questions