

Answered step by step
Verified Expert Solution
Question
1 Approved Answer
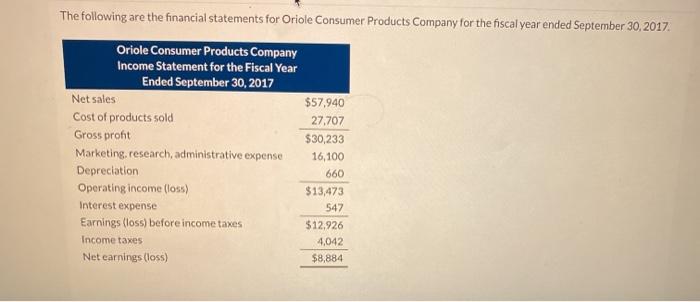
The following are the financial statements for Oriole Consumer Products Company for the fiscal year ended September 30, 2017 Oriole Consumer Products Company Income Statement
Step by Step Solution
There are 3 Steps involved in it
Step: 1

Get Instant Access to Expert-Tailored Solutions
See step-by-step solutions with expert insights and AI powered tools for academic success
Step: 2

Step: 3
Ace Your Homework with AI
Get the answers you need in no time with our AI-driven, step-by-step assistance
Get Started
Introduction To Finance Financial Management And Investment Management
Authors: Pamela P. Drake, Frank J. Fabozzi, Francesco A. Fabozzi
1st Edition
9811239657, 978-9811239656