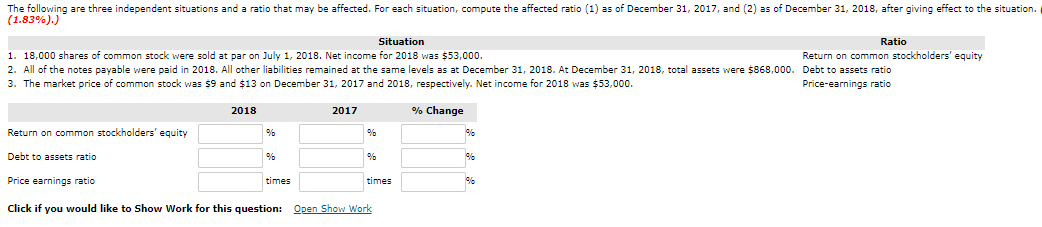
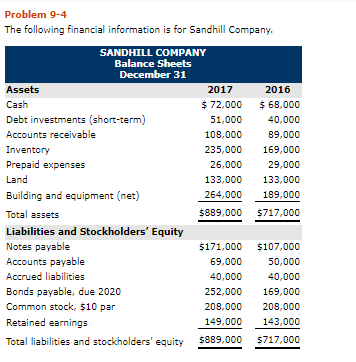
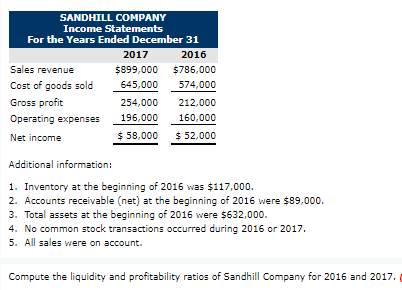
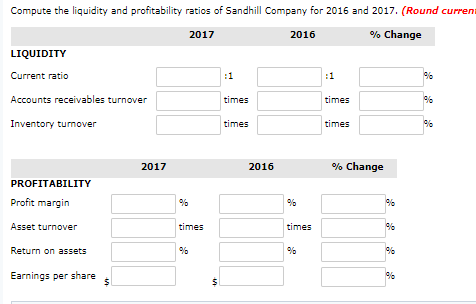
The following are three independent situations and a ratio that may be affected. For each situation, compute the affected ratio (1) as of December 31, 2017, and (2) as of December 31, 2018, after giving effect to the situation. (1.83%).) Situation Ratio 1. 18,000 shares of common stock were sold at par on July 1, 2018. Net income for 2018 was $53,000. Return on common stockholders' equity 2. All of the notes payable were paid in 2018. All other liabilities remained at the same levels as at December 31, 2018. At December 31, 2018, total assets were $868,000. Debt to assets ratio 3. The market price of common stock was s9 and $13 on December 31, 2017 and 2018, respectively. Net income for 2018 was $53,000. Price-earnings ratio 2018 2017 % Change Return on common stockholders' equity %6 % 96 Debt to assets ratio %6 % 96 Price earnings ratio times times 96 Click if you would like to Show Work for this question: Open Show Work Problem 9-4 The following financial information is for Sandhill Company. SANDHILL COMPANY Balance Sheets December 31 Assets 2017 2016 Cash $ 72,000 $ 68,000 Debt investments (short-term) 51,000 40,000 Accounts receivable 108,000 89,000 Inventory 235,000 169,000 Prepaid expenses 26,000 29,000 Land 133,000 133,000 Building and equipment (net) 264,000 189,000 Total assets $889,000 $717,000 Liabilities and Stockholders' Equity Notes payable $171,000 $107,000 Accounts payable 69,000 50,000 Accrued liabilities 40,000 40,000 Bonds payable, due 2020 252,000 169,000 Common stock, $10 par 208,000 208,000 Retained earnings 149,000 143,000 Total liabilities and stockholders' equity 5889,000 $717.000 SANDHILL COMPANY Income Statements For the Years Ended December 31 2017 2016 Sales revenue $899,000 $786,000 Cost of goods sold 645,000 574,000 Gross profit 254,000 212,000 Operating expenses 196,000 160,000 Net income $ 58,000 $ 52,000 Additional information: 1. Inventory at the beginning of 2016 was $117,000. 2. Accounts receivable (net) at the beginning of 2016 were $89,000. 3. Total assets at the beginning of 2016 were $632,000. 4. No common stock transactions occurred during 2016 or 2017. 5. All sales were on account. Compute the liquidity and profitability ratios of Sandhill Company for 2016 and 2017. Compute the liquidity and profitability ratios of Sandhill Company for 2016 and 2017. (Round curren 2017 2016 % Change LIQUIDITY Current ratio :1 9 Accounts receivables turnover times times 9 Inventory turnover times times 96 2017 2016 % Change PROFITABILITY Profit margin % % 90 Asset turnover times times 96 Return on assets 6 % Earnings per share 9 $ 6 S