

Question
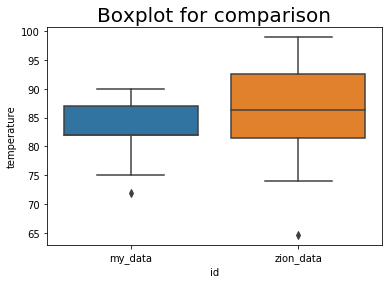
The following box plot is generated from your temperature distributions temperatures = [90, 82, 81, 84, 88, 82, 88, 82, 72, 75, 82, 82, 84,
The following box plot is generated from your temperature distributions
temperatures = [90, 82, 81, 84, 88, 82, 88, 82, 72, 75, 82, 82, 84, 90]
The graph showed the difference in the distribution of your data and Zion's data? What can you say about the differences in data distributions?
(Note: You are not required to know how this data was generated. Note that the temperature data for Zion will be unique to you.)
Step by Step Solution
There are 3 Steps involved in it
Step: 1

Get Instant Access to Expert-Tailored Solutions
See step-by-step solutions with expert insights and AI powered tools for academic success
Step: 2

Step: 3
Ace Your Homework with AI
Get the answers you need in no time with our AI-driven, step-by-step assistance
Get Started
Calculus An Applied Approach
Authors: Ron Larson, Dennis J McKenzie, Larson/Edwards, Bruce H Edwards
7th Edition