Answered step by step
Verified Expert Solution
Question
1 Approved Answer
The following chart provides the ROE disaggregation for a hypothetical company. ROE 4.0% RNOA 8.0% NOPM 16.0% NOAT 0.50 FLEV 2.00 SPREAD -2.0% 1. What
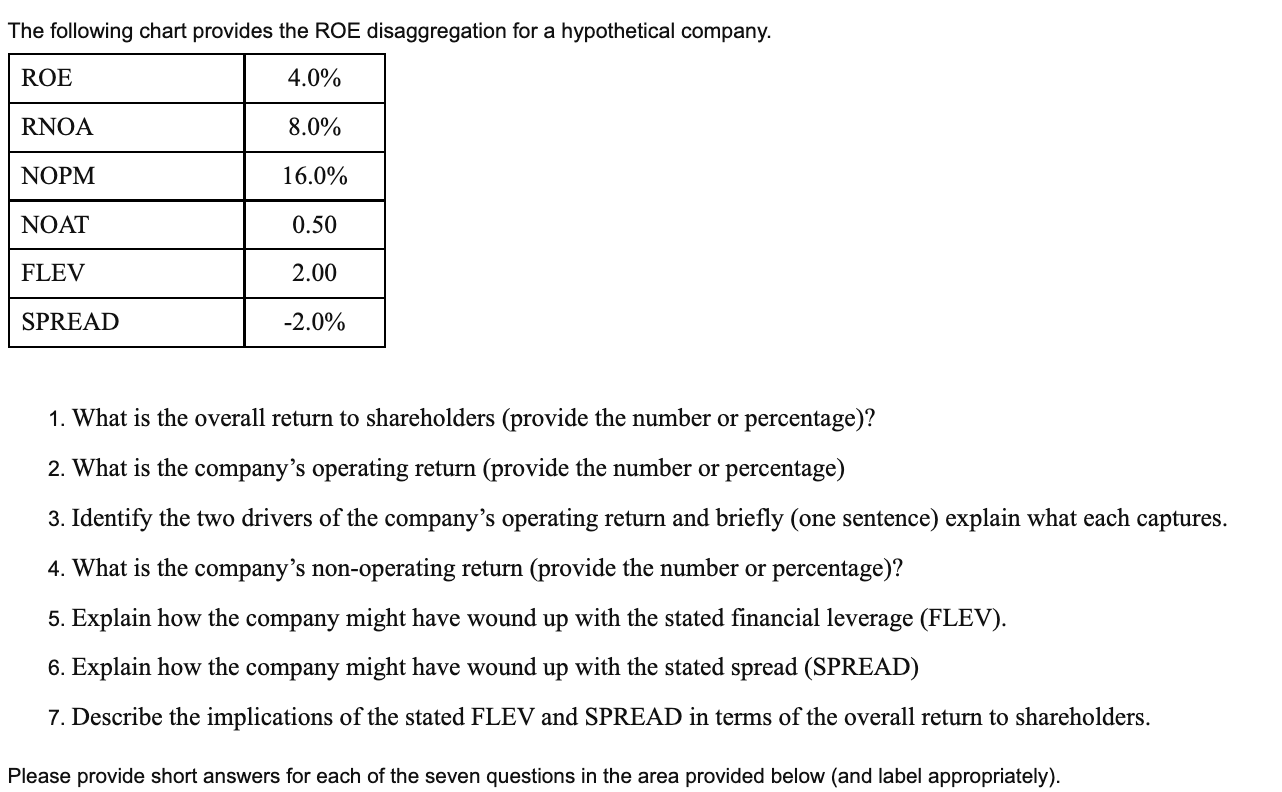
The following chart provides the ROE disaggregation for a hypothetical company. ROE 4.0% RNOA 8.0% NOPM 16.0% NOAT 0.50 FLEV 2.00 SPREAD -2.0% 1. What is the overall return to shareholders (provide the number or percentage)? 2. What is the company's operating return (provide the number or percentage) 3. Identify the two drivers of the company's operating return and briefly (one sentence) explain what each captures. 4. What is the company's non-operating return (provide the number or percentage)? 5. Explain how the company might have wound up with the stated financial leverage (FLEV). 6. Explain how the company might have wound up with the stated spread (SPREAD) 7. Describe the implications of the stated FLEV and SPREAD in terms of the overall return to shareholders. Please provide short answers for each of the seven questions in the area provided below (and label appropriately)
Step by Step Solution
There are 3 Steps involved in it
Step: 1
Get Instant Access to Expert-Tailored Solutions
See step-by-step solutions with expert insights and AI powered tools for academic success
Step: 2
Step: 3
Ace Your Homework with AI
Get the answers you need in no time with our AI-driven, step-by-step assistance
Get Started