Answered step by step
Verified Expert Solution
Question
1 Approved Answer
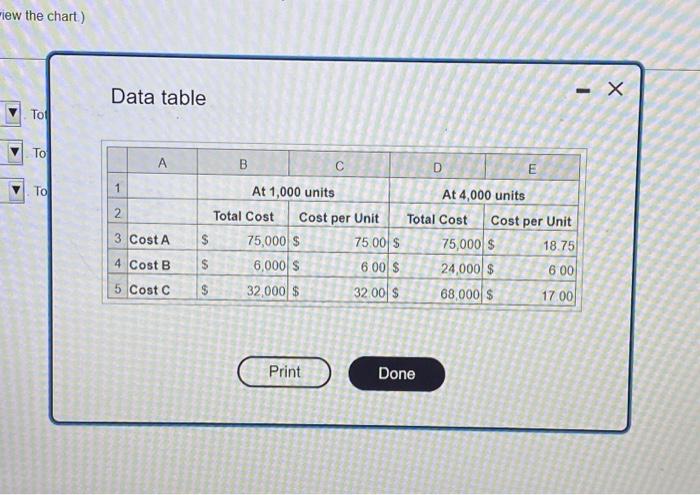
The following chart shows three different costs Cost A, Cost B, and Cost C For each cost, the chart shows the total cost and cost
The following chart shows three different costs Cost A, Cost B, and Cost C For each cost, the chart shows the total cost and cost per unit at two different volumes within the same relevant range. Based on this information, identify each cost as fixed, variable, or mixed. Explain your answers. (Click the icon to view the chart) Cost A is a Cost B is a Cost C is a Total costs Total costs Total costs and the per unit costs and the per unit costs and the per unit costs as the volume increases. as the volume increases as the volume increases.


Step by Step Solution
There are 3 Steps involved in it
Step: 1

Get Instant Access to Expert-Tailored Solutions
See step-by-step solutions with expert insights and AI powered tools for academic success
Step: 2

Step: 3

Ace Your Homework with AI
Get the answers you need in no time with our AI-driven, step-by-step assistance
Get Started


