Question
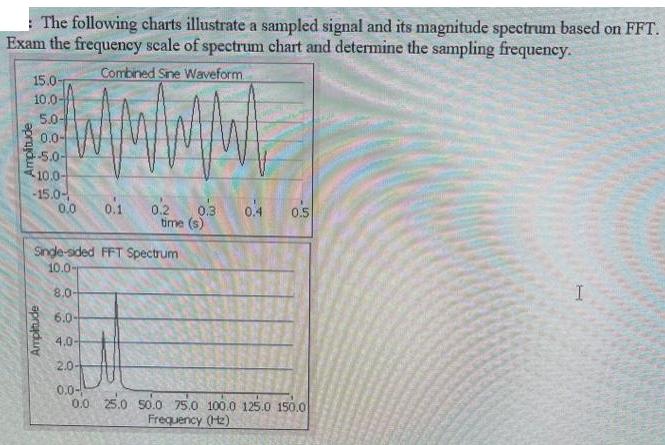
The following charts illustrate a sampled signal and its magnitude spectrum based on FFT. Exam the frequency scale of spectrum chart and determine the

The following charts illustrate a sampled signal and its magnitude spectrum based on FFT. Exam the frequency scale of spectrum chart and determine the sampling frequency. Combined Sine Waveform 15.0- 10.0- 5.0- 0.0- -5.0- 10.0- -15.0- Amplitude 0,0 Amplitude 0.1 0.2 Single-sided FFT Spectrum 10.0- 8.0- 6.0- 4.0- M 2.0- 0.3 time (s) 0.4 0.5 0.0- 0.0 25.0 50.0 75.0 100.0 125.0 150.0 Frequency (Hz) I
Step by Step Solution
3.41 Rating (151 Votes )
There are 3 Steps involved in it
Step: 1
For a single sided spectrum of a signal in MATLAB t...
Get Instant Access to Expert-Tailored Solutions
See step-by-step solutions with expert insights and AI powered tools for academic success
Step: 2

Step: 3

Ace Your Homework with AI
Get the answers you need in no time with our AI-driven, step-by-step assistance
Get StartedRecommended Textbook for
Signals and Systems using MATLAB
Authors: Luis Chaparro
2nd edition
123948126, 978-0123948120
Students also viewed these Accounting questions
Question
Answered: 1 week ago
Question
Answered: 1 week ago
Question
Answered: 1 week ago
Question
Answered: 1 week ago
Question
Answered: 1 week ago
Question
Answered: 1 week ago
Question
Answered: 1 week ago
Question
Answered: 1 week ago
Question
Answered: 1 week ago
Question
Answered: 1 week ago
Question
Answered: 1 week ago
Question
Answered: 1 week ago
Question
Answered: 1 week ago
Question
Answered: 1 week ago
Question
Answered: 1 week ago
Question
Answered: 1 week ago
Question
Answered: 1 week ago
Question
Answered: 1 week ago
Question
Answered: 1 week ago
Question
Answered: 1 week ago
Question
Answered: 1 week ago
Question
Answered: 1 week ago
View Answer in SolutionInn App


