

Answered step by step
Verified Expert Solution
Question
1 Approved Answer
The following code do the Discrete Cosine Transform ( DCT ) and Inverse DCT with 6 4 coefficients. % matplotlib inline import matplotlib.pyplot as plt
The following code do the Discrete Cosine TransformDCT and Inverse DCT with coefficients.
matplotlib inline
import matplotlib.pyplot as plt
from matplotlib.gridspec import GridSpec
import numpy as np
from sklearn.datasets import loadsampleimage
from scipy.fftpack import dctn idctn
from scipy.spatial.distance import pdist
# helper functions to extract patches from an image
def imtopatchim patchsize:
return imreshapeimshape patchsize patchsize imshape patchsize patchsizeswapaxesreshape patchsize patchsizecopy
def patchtoimpatches patchsize, imsize:
return patches.reshapeimsize patchsize imsize patchsize patchsize patchsizeswapaxesreshapeimsizecopy
def imtovecim patchsize:
return imreshapeimshape patchsize patchsize imshape patchsize patchsizeswapaxesreshape patchsize patchsizecopy
def vectoimvec patchsize, imsize:
return vec.reshapeimsize patchsize imsize patchsize patchsize patchsizeswapaxesreshapeimsizecopy
# accuracy metric MSE
def mseoriginal noisy:
return npsumoriginal noisy
china loadsampleimagechinajpgmeanaxis: :
chinadct dctnimtopatchchina axes
x y npmgrid: :
ncoefs
chinadct npwherenplogicalandx npsqrtncoefs y npsqrtncoefs chinadct
chinarc patchtoimidctnchinadct axes
print Components MSE :gformatmsechina chinarc
pltimshowchinarc cmap'plasma'
pltshow
The following code visualizes the basis vectors used to reconstruct each patch of the image:
from matplotlib import colors
def makedctbasiscoefs patchsize:
basis npemptytuplecoefs tuplepatchsize
x y npmgrid:patchsize :patchsize
for i in rangecoefs:
for j in rangecoefs:
basisi j npcosnppi x i coefs npcosnppi y j coefs
return basis
dctvecs makedctbasis
fig, axes pltsubplots figsize
ims
for i in range:
for j in range:
ims axesi jimshowdctvecsi j cmap'binary'
axesi jsetaxisoff
vmin minimgetarraymin for im in ims
vmax maximgetarraymax for im in ims
norm colors.Normalizevminvmin, vmaxvmax
for im in ims:
imsetnormnorm
fig.suptitleDCT Basis Patches'
pltshow
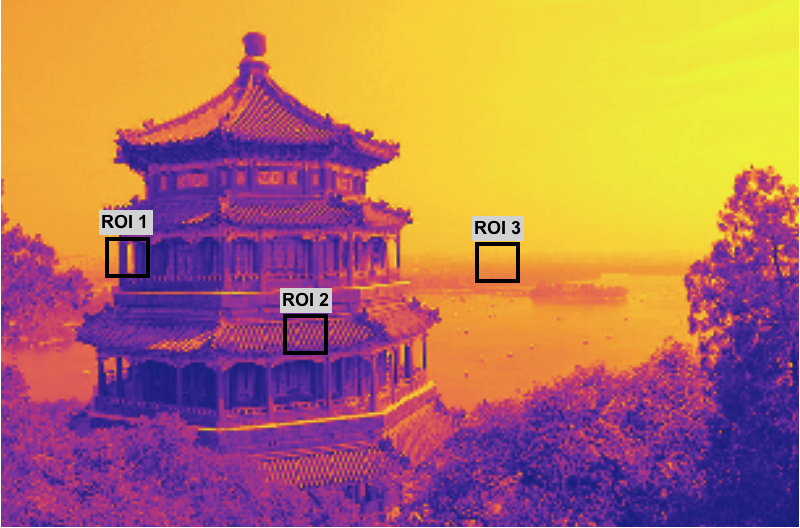
According the things mentioned above, which DCT basis vectors will likely be used to represent the selected regions ROIs within the image below? Provide the rationale and write a python code to test this hypothesis.
ROI
ROI
ROI
Step by Step Solution
There are 3 Steps involved in it
Step: 1

Get Instant Access to Expert-Tailored Solutions
See step-by-step solutions with expert insights and AI powered tools for academic success
Step: 2

Step: 3
Ace Your Homework with AI
Get the answers you need in no time with our AI-driven, step-by-step assistance
Get Started
Entity Alignment Concepts Recent Advances And Novel Approaches
Authors: Xiang Zhao ,Weixin Zeng ,Jiuyang Tang
1st Edition
9819942527, 978-9819942527