

Answered step by step
Verified Expert Solution
Question
1 Approved Answer
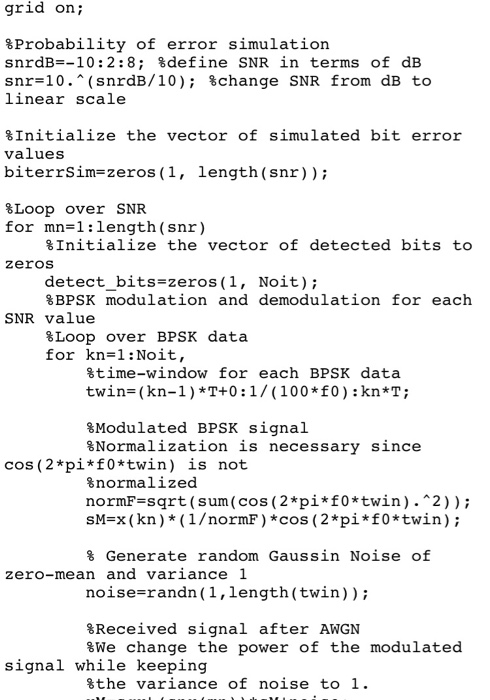
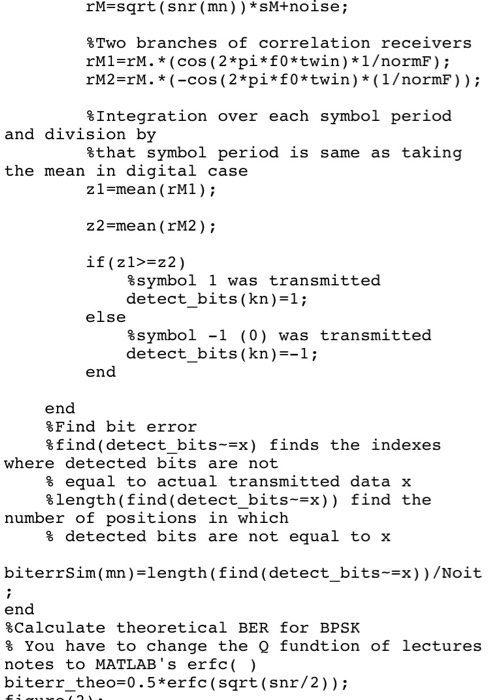
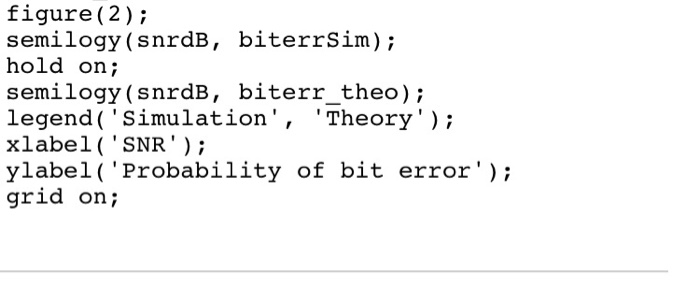
The following code from Matlab is of BPSK modulation and demodulation. I need to generate QPSK symbols from this code. Any help would be appreciated.
The following code from Matlab is of BPSK modulation and demodulation. I need to generate QPSK symbols from this code. Any help would be appreciated. 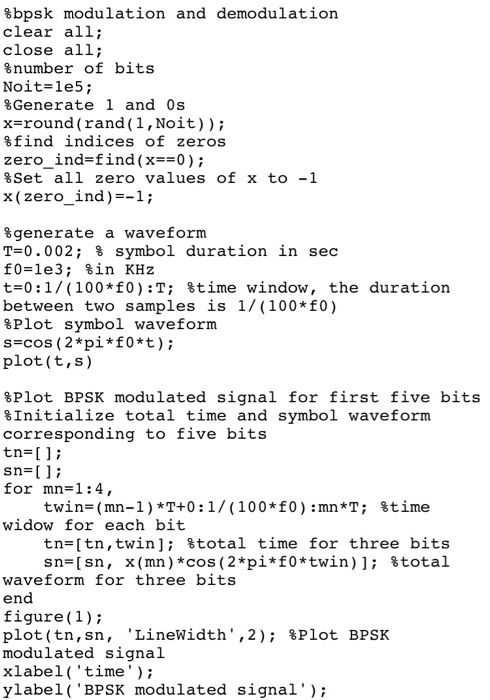
Step by Step Solution
There are 3 Steps involved in it
Step: 1

Get Instant Access to Expert-Tailored Solutions
See step-by-step solutions with expert insights and AI powered tools for academic success
Step: 2

Step: 3
Ace Your Homework with AI
Get the answers you need in no time with our AI-driven, step-by-step assistance
Get Started
SQL Instant Reference
Authors: Gruber, Martin Gruber
2nd Edition
0782125395, 9780782125399