

Answered step by step
Verified Expert Solution
Question
1 Approved Answer
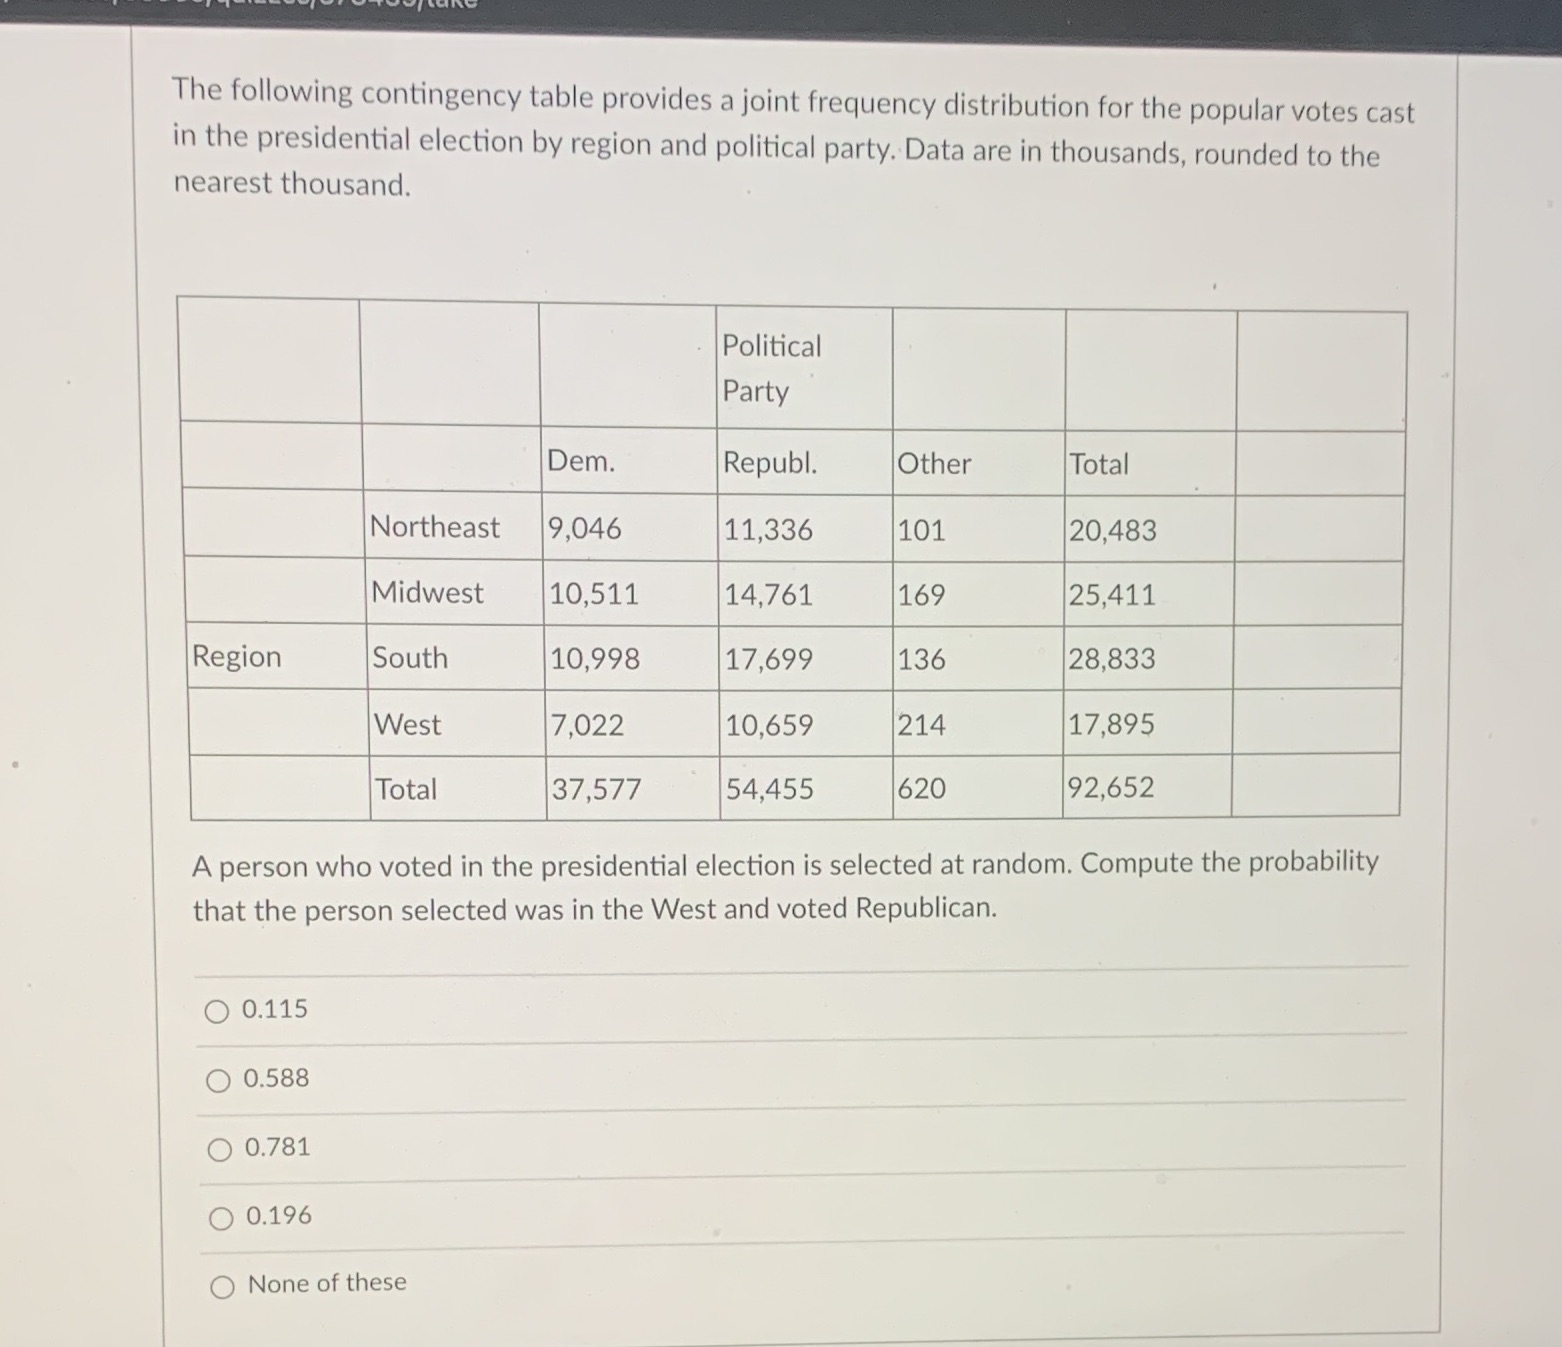
The following contingency table provides a joint frequency distribution for the popular votes cast in the presidential election by region and political party. Data are
Step by Step Solution
There are 3 Steps involved in it
Step: 1

Get Instant Access to Expert-Tailored Solutions
See step-by-step solutions with expert insights and AI powered tools for academic success
Step: 2

Step: 3
Ace Your Homework with AI
Get the answers you need in no time with our AI-driven, step-by-step assistance
Get Started
Trigonometry, Enhanced
Authors: Cynthia Y Young
4th Edition
1119321131, 9781119321132