

Answered step by step
Verified Expert Solution
Question
1 Approved Answer
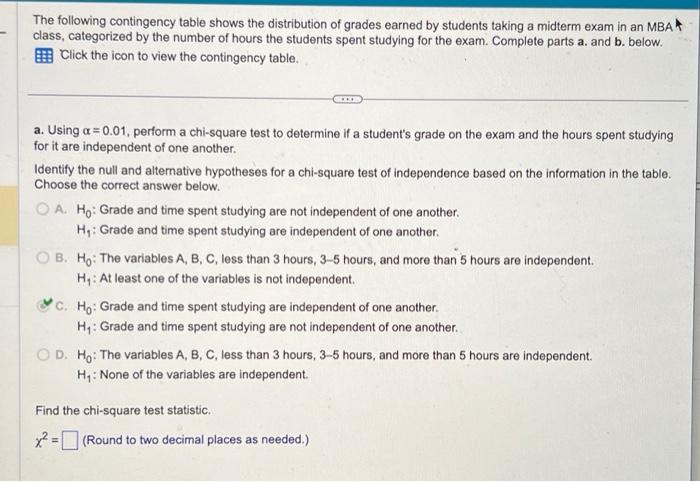
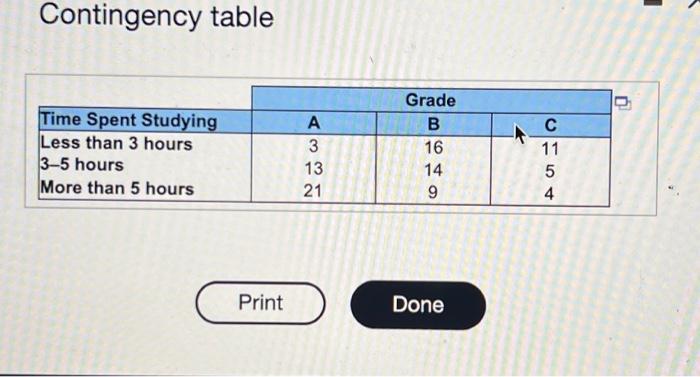
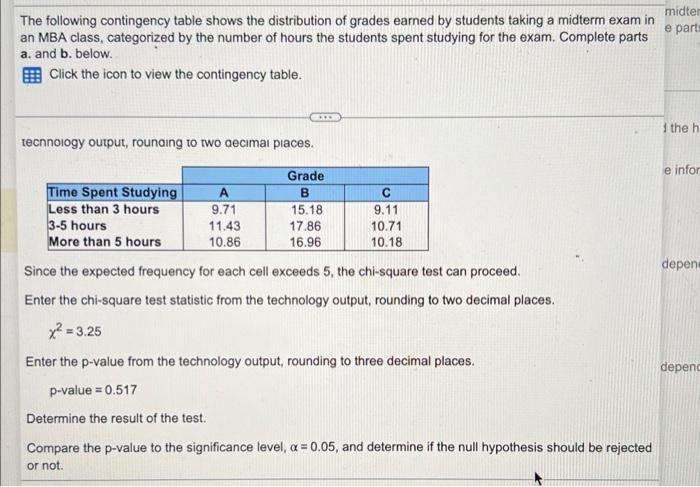
The following contingency table shows the distribution of grades earned by students taking a midterm exam in an MBA class, categorized by the number of
Step by Step Solution
There are 3 Steps involved in it
Step: 1

Get Instant Access to Expert-Tailored Solutions
See step-by-step solutions with expert insights and AI powered tools for academic success
Step: 2

Step: 3
Ace Your Homework with AI
Get the answers you need in no time with our AI-driven, step-by-step assistance
Get Started
An Audit Of The Case Study Method
Authors: Michael Masoner
1st Edition
027592761X, 978-0275927615