

Question
The following data are from an experiment designed to investigate the perception of corporate ethical values among individuals specializing in marketing (higher scores indicate higher
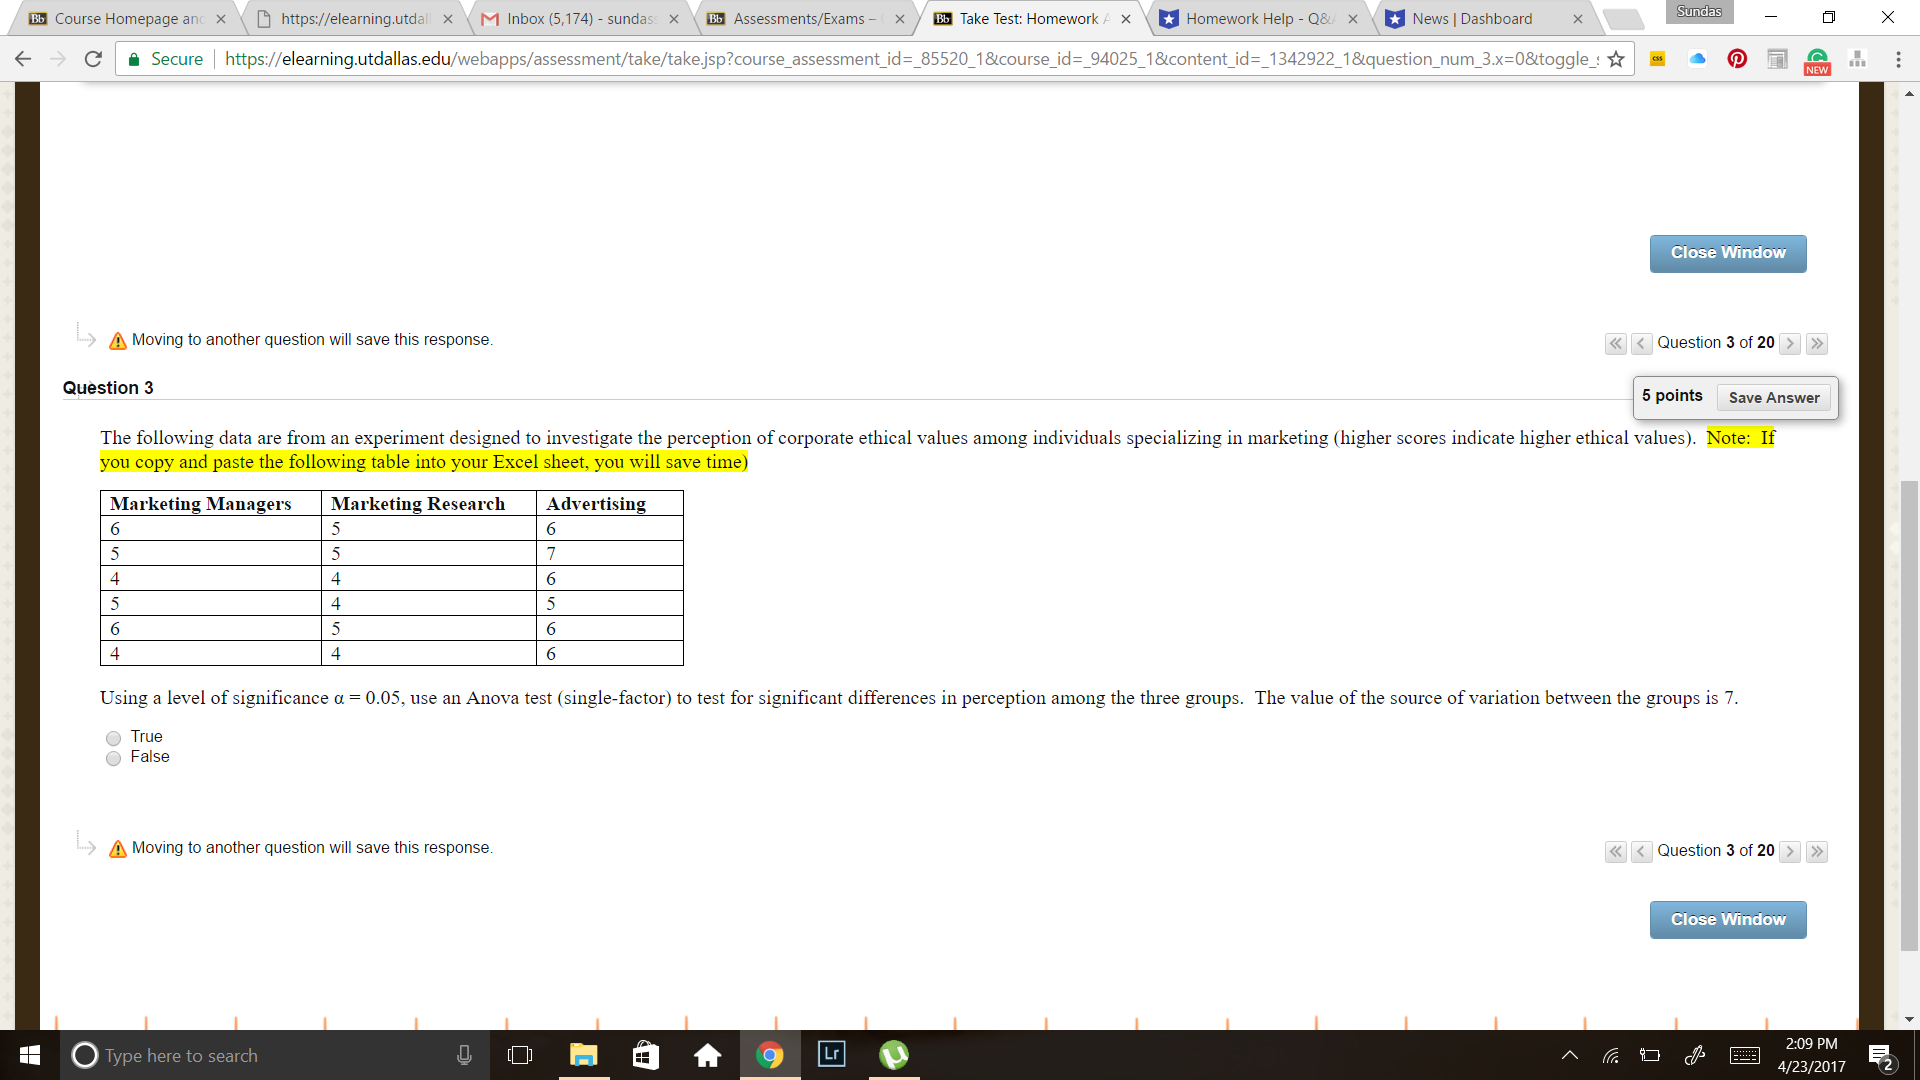
The following data are from an experiment designed to investigate the perception of corporate ethical values among individuals specializing in marketing (higher scores indicate higher ethical values).Note:If you copy and paste the following table into your Excel sheet, you will save time)
Marketing Managers
Marketing Research
Advertising
6
5
6
5
5
7
4
4
6
5
4
5
6
5
6
4
4
6
Using a level of significance= 0.05, use an Anova test (single-factor) to test for significant differences in perception among the three groups.The value of the source of variation between the groups is 7.
True
False
Step by Step Solution
There are 3 Steps involved in it
Step: 1

Get Instant Access to Expert-Tailored Solutions
See step-by-step solutions with expert insights and AI powered tools for academic success
Step: 2

Step: 3
Ace Your Homework with AI
Get the answers you need in no time with our AI-driven, step-by-step assistance
Get Started
Introduction to Real Analysis
Authors: Robert G. Bartle, Donald R. Sherbert
4th edition
471433314, 978-1118135853, 1118135857, 978-1118135860, 1118135865, 978-0471433316