Answered step by step
Verified Expert Solution
Question
1 Approved Answer
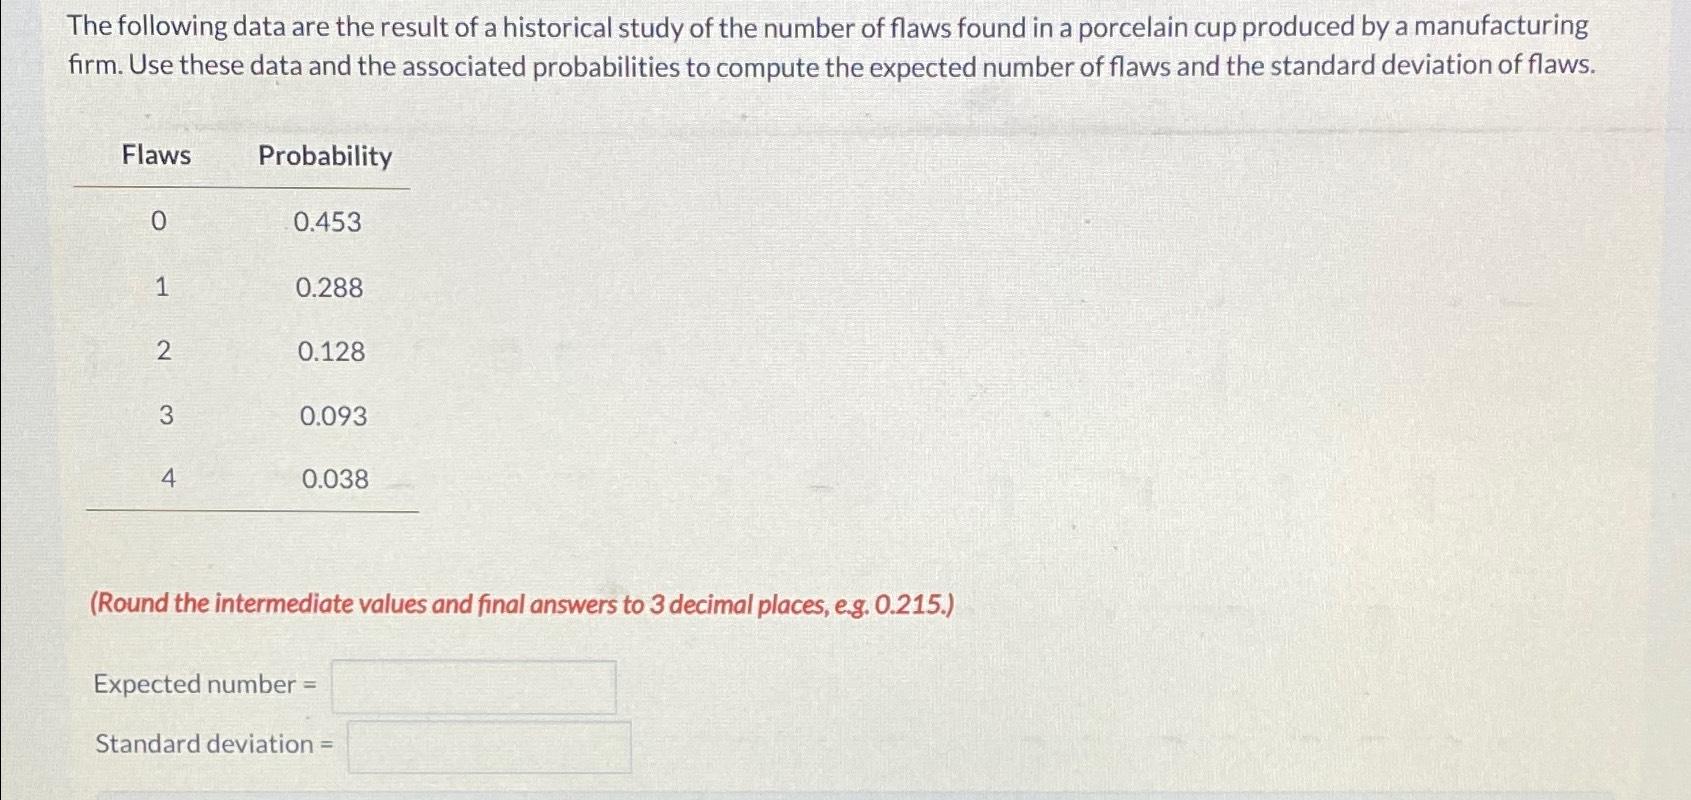
The following data are the result of a historical study of the number of flaws found in a porcelain cup produced by a manufacturing firm.
The following data are the result of a historical study of the number of flaws found in a porcelain cup produced by a manufacturing firm. Use these data and the associated probabilities to compute the expected number of flaws and the standard deviation of flaws.
tableFlawsProbability
Round the intermediate values and final answers to decimal places, eg
Expected number
Standard deviation

Step by Step Solution
There are 3 Steps involved in it
Step: 1

Get Instant Access to Expert-Tailored Solutions
See step-by-step solutions with expert insights and AI powered tools for academic success
Step: 2

Step: 3

Ace Your Homework with AI
Get the answers you need in no time with our AI-driven, step-by-step assistance
Get Started


