Question
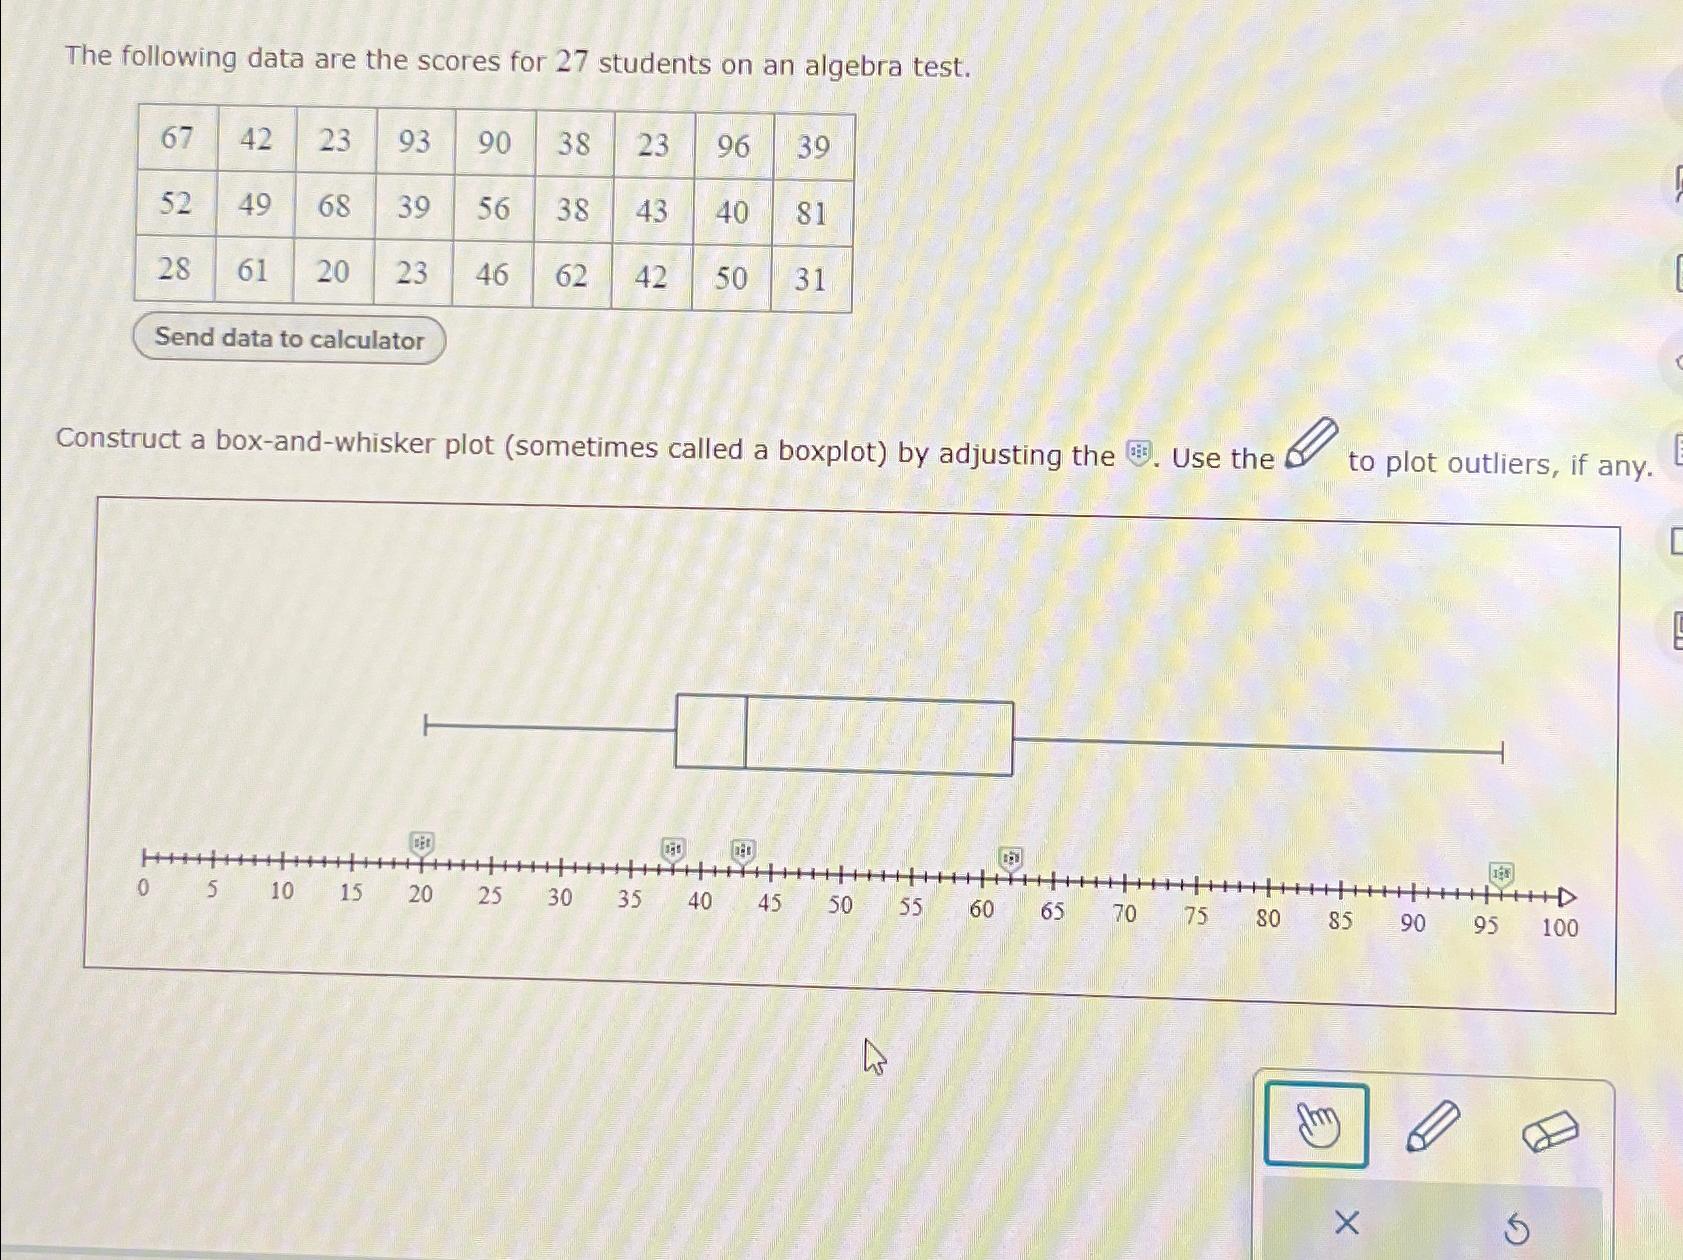
The following data are the scores for 27 students on an algebra test. 67 52 28 42 23 93 90 49 68 39 56

The following data are the scores for 27 students on an algebra test. 67 52 28 42 23 93 90 49 68 39 56 61 20 46 23 Send data to calculator 0 5 10 15 D Construct a box-and-whisker plot (sometimes called a boxplot) by adjusting the . Use the 3 38 23 96 39 38 43 40 81 62 42 50 31 20 125 30 +++++++++++ +++ 35 40 45 50 55 60 65 70 75 80 to plot outliers, if any. 85 90 95 100 X J G C E
Step by Step Solution
There are 3 Steps involved in it
Step: 1
To construct a boxandwhisker plot for the given data we need to arrange the scores in ascending orde...
Get Instant Access to Expert-Tailored Solutions
See step-by-step solutions with expert insights and AI powered tools for academic success
Step: 2

Step: 3

Ace Your Homework with AI
Get the answers you need in no time with our AI-driven, step-by-step assistance
Get StartedRecommended Textbook for
An Introduction To Statistical Methods And Data Analysis
Authors: R. Lyman Ott, Micheal T. Longnecker
7th Edition
1305269470, 978-1305465527, 1305465520, 978-1305269477
Students also viewed these Mathematics questions
Question
Answered: 1 week ago
Question
Answered: 1 week ago
Question
Answered: 1 week ago
Question
Answered: 1 week ago
Question
Answered: 1 week ago
Question
Answered: 1 week ago
Question
Answered: 1 week ago
Question
Answered: 1 week ago
Question
Answered: 1 week ago
Question
Answered: 1 week ago
Question
Answered: 1 week ago
Question
Answered: 1 week ago
Question
Answered: 1 week ago
Question
Answered: 1 week ago
Question
Answered: 1 week ago
Question
Answered: 1 week ago
Question
Answered: 1 week ago
Question
Answered: 1 week ago
Question
Answered: 1 week ago
Question
Answered: 1 week ago
Question
Answered: 1 week ago
Question
Answered: 1 week ago
View Answer in SolutionInn App


