Question
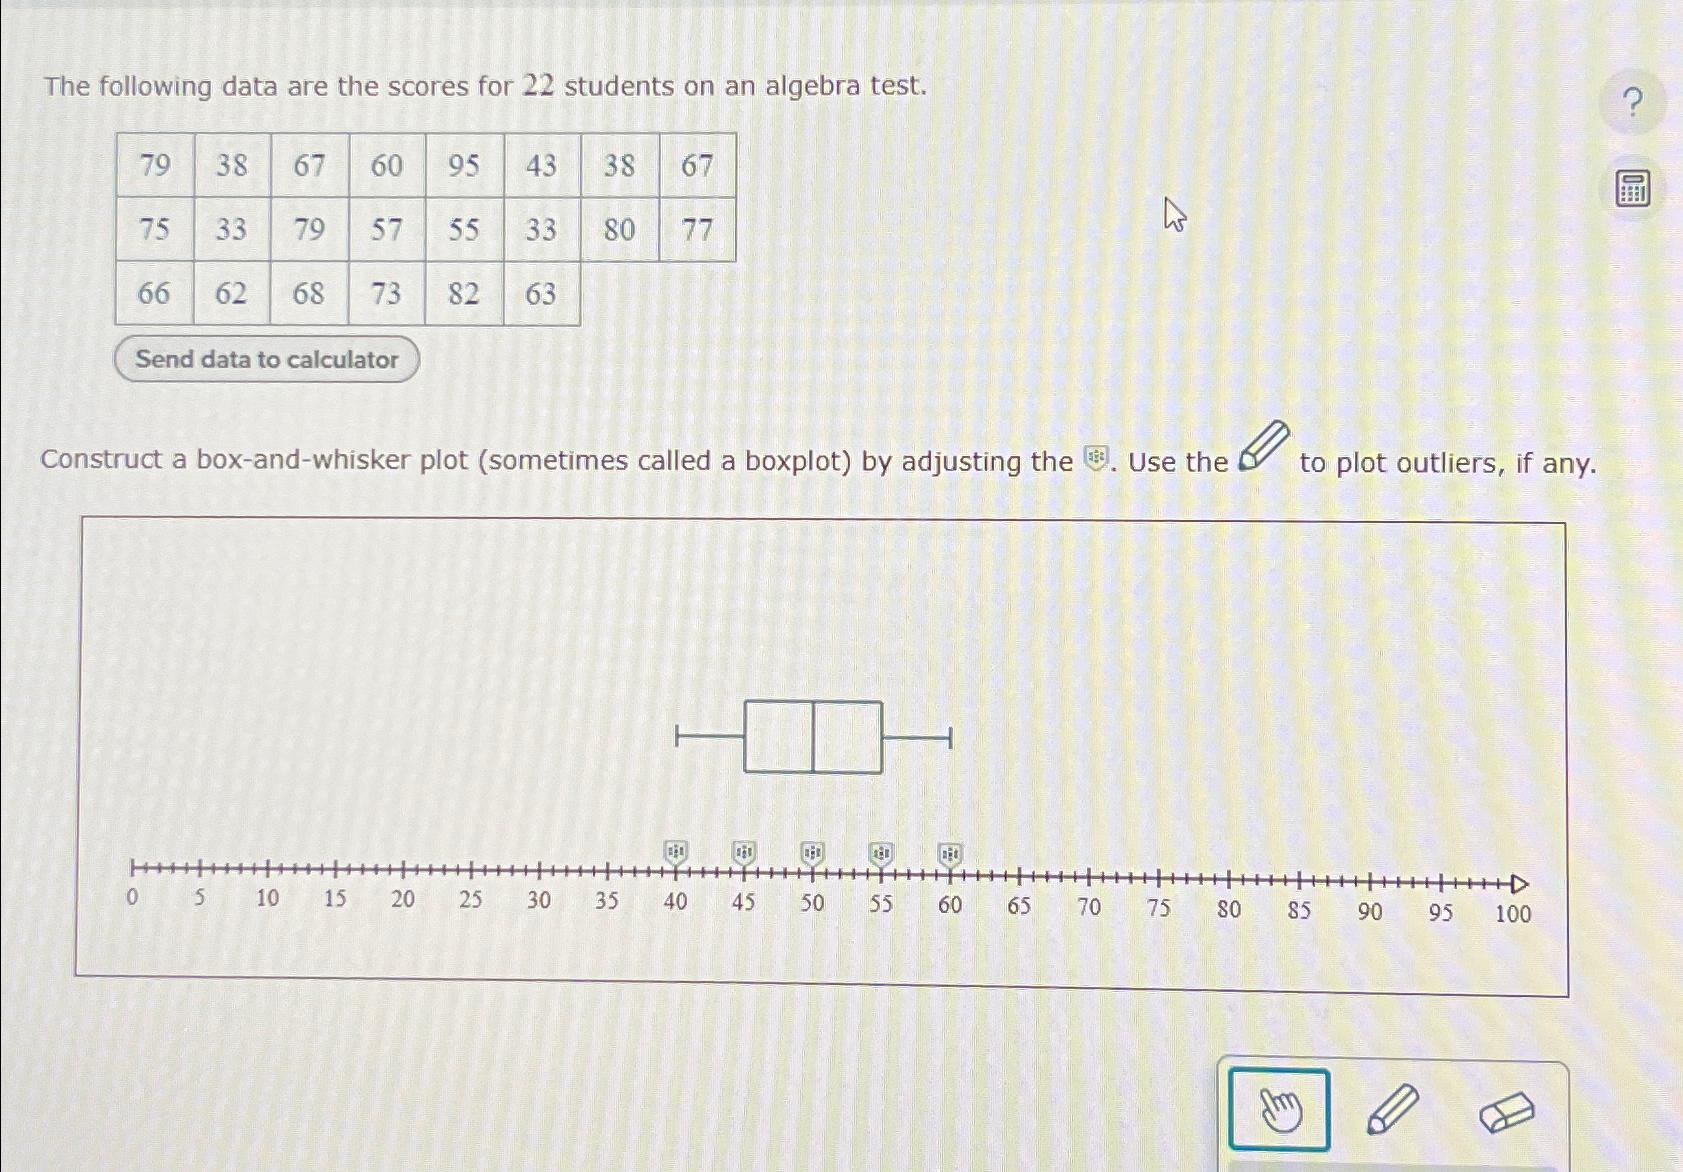
The following data are the scores for 22 students on an algebra test. 79 75 66 38 67 60 33 79 62 0 95

The following data are the scores for 22 students on an algebra test. 79 75 66 38 67 60 33 79 62 0 95 43 38 67 57 55 33 80 77 68 73 82 63 Send data to calculator D Construct a box-and-whisker plot (sometimes called a boxplot) by adjusting the. Use the E B +++++++ +|++++++++++++++++++++++ 5 10 15 20 25 30 35 40 45 50 55 60 65 70 75 80 to plot outliers, if any. |++++++++++++++D 85 90 95 100 Amm
Step by Step Solution
There are 3 Steps involved in it
Step: 1
To construct a boxandwhisker plot for the given data we need to arrange the scores in ascending orde...
Get Instant Access to Expert-Tailored Solutions
See step-by-step solutions with expert insights and AI powered tools for academic success
Step: 2

Step: 3

Ace Your Homework with AI
Get the answers you need in no time with our AI-driven, step-by-step assistance
Get StartedRecommended Textbook for
Statistics
Authors: Robert S. Witte, John S. Witte
11th Edition
1119254515, 978-1119254515
Students also viewed these Mathematics questions
Question
Answered: 1 week ago
Question
Answered: 1 week ago
Question
Answered: 1 week ago
Question
Answered: 1 week ago
Question
Answered: 1 week ago
Question
Answered: 1 week ago
Question
Answered: 1 week ago
Question
Answered: 1 week ago
Question
Answered: 1 week ago
Question
Answered: 1 week ago
Question
Answered: 1 week ago
Question
Answered: 1 week ago
Question
Answered: 1 week ago
Question
Answered: 1 week ago
Question
Answered: 1 week ago
Question
Answered: 1 week ago
Question
Answered: 1 week ago
Question
Answered: 1 week ago
Question
Answered: 1 week ago
Question
Answered: 1 week ago
Question
Answered: 1 week ago
Question
Answered: 1 week ago
Question
Answered: 1 week ago
View Answer in SolutionInn App


