

Answered step by step
Verified Expert Solution
Question
1 Approved Answer
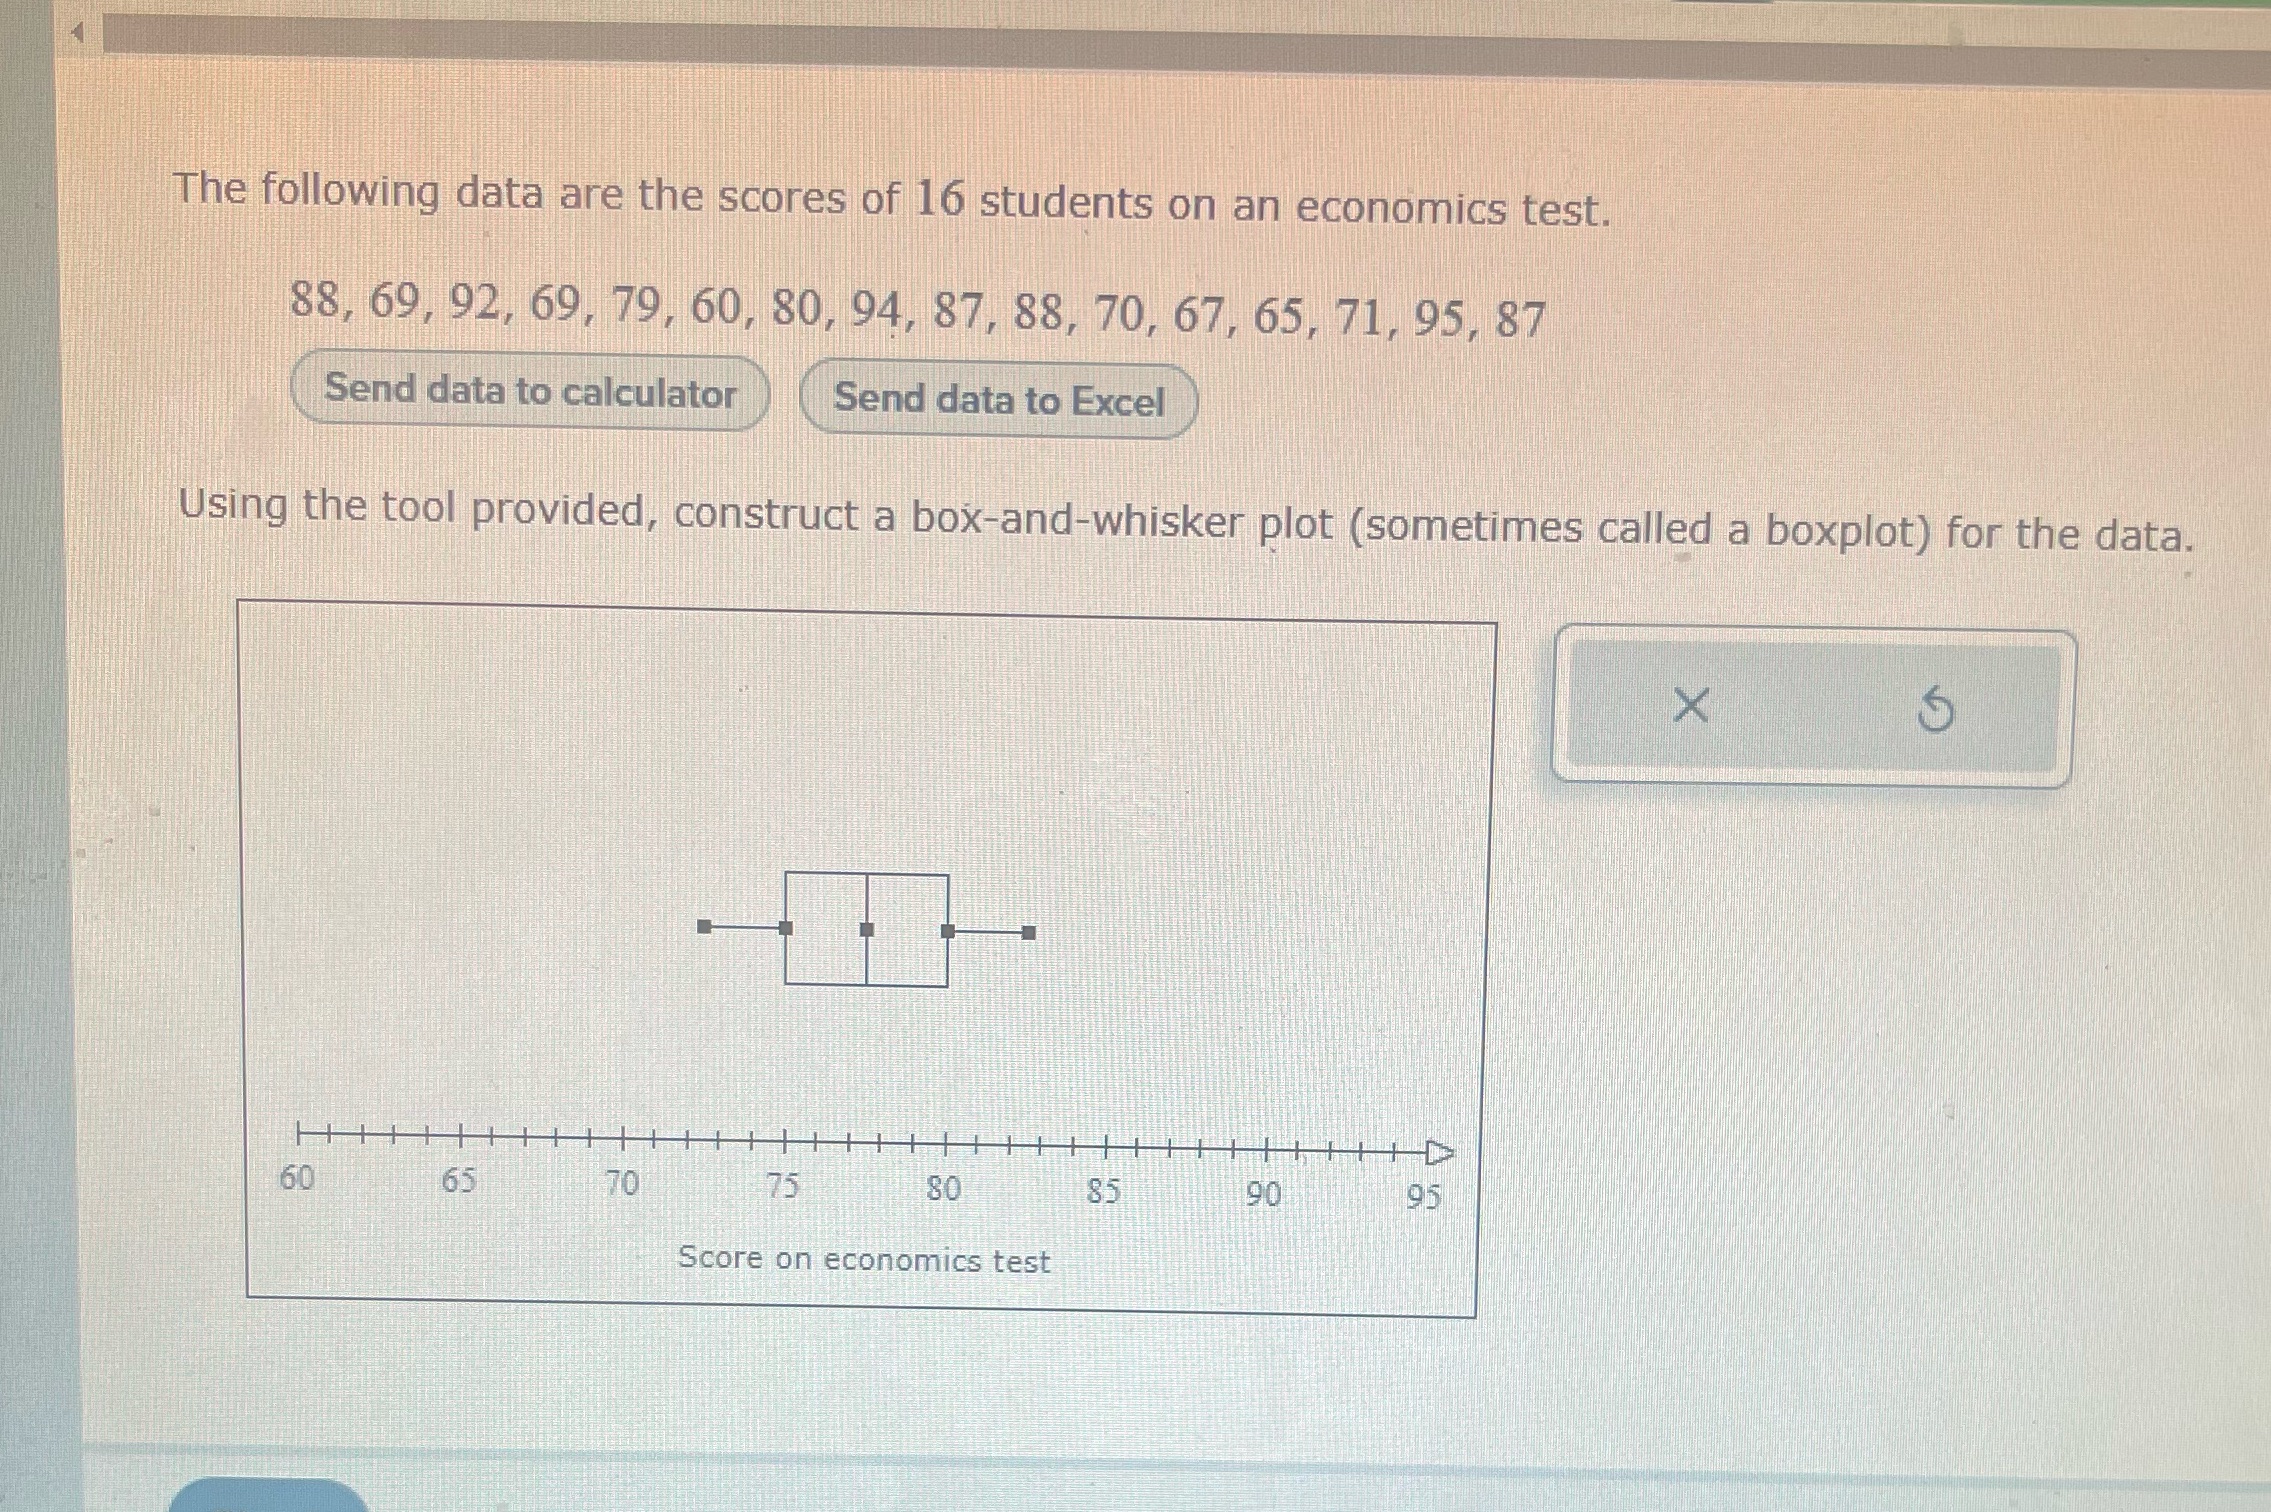
The following data are the scores of 16 students on an economics test. 88, 69, 92, 69, 79, 60, 80, 94, 87, 88, 70, 67,
Step by Step Solution
There are 3 Steps involved in it
Step: 1

Get Instant Access to Expert-Tailored Solutions
See step-by-step solutions with expert insights and AI powered tools for academic success
Step: 2

Step: 3
Ace Your Homework with AI
Get the answers you need in no time with our AI-driven, step-by-step assistance
Get Started
College Algebra
Authors: Michael Sullivan, Michael Sullivan III
11th Edition
0135226864, 9780135226865