

Answered step by step
Verified Expert Solution
Question
1 Approved Answer
The following data have been collected for a British health care IT project for two-week reporting periods 2 through 12. Compute the SV, CV, SPI,
The following data have been collected for a British health care IT project for two-week reporting periods 2 through 12. Compute the SV, CV, SPI, CPI, and PCIB for each period. Task DUR 1 2 3 4 5 1 4 0 4 4 6 4 8 6 4 4 8 ES 0 4 4 4 10 8 4 2 6 4 0 4 2 12 2 8 14 3 10 0 6 10 4 8 2 2 6 4 10 4 LF 4 14 10 10 14 18 SL ON ON ON 2 E 00 PV ($00) 0 8 40 30 20 10 5 14 0 0 10 4 14 40 60 8 6 16 2 2 10 18 8 Baseline (PV) ($00) 4 2 4 4 10 10 14 0 14 15 10 10 7 6 8 10 12 10 10 10 4 5 18 0 18 on a un m 14 20 20 16 20 20 10 10 22 18 8 0 0 18 4 22 Legend ES ID EF SL SL LS DUR LF 18 20 22 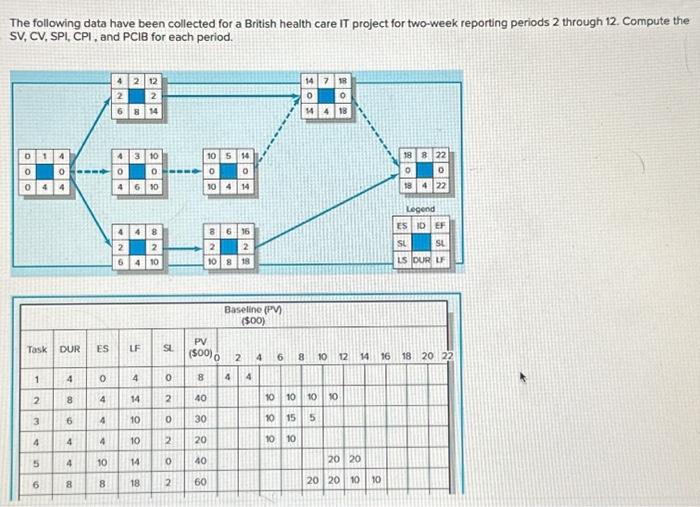
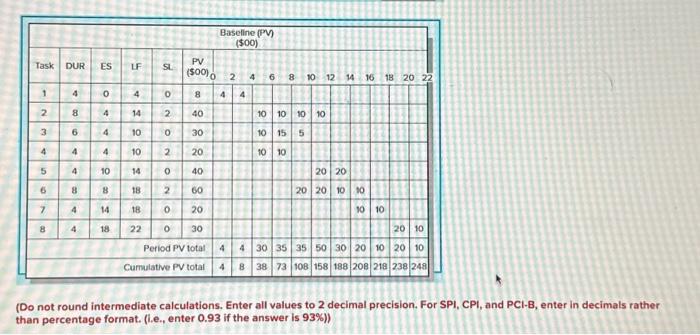
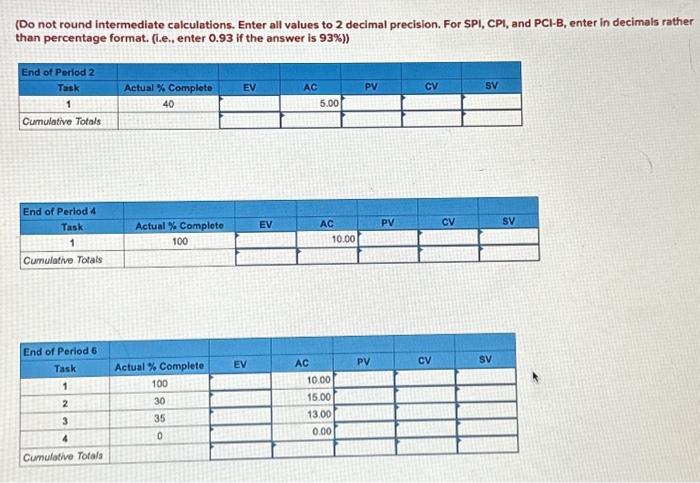
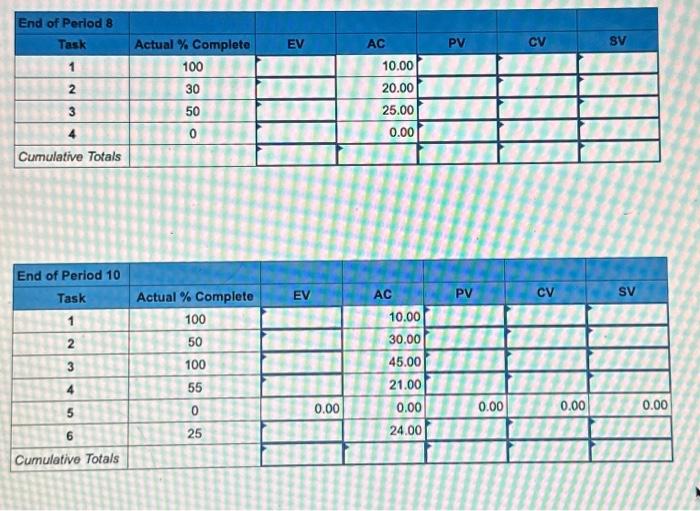
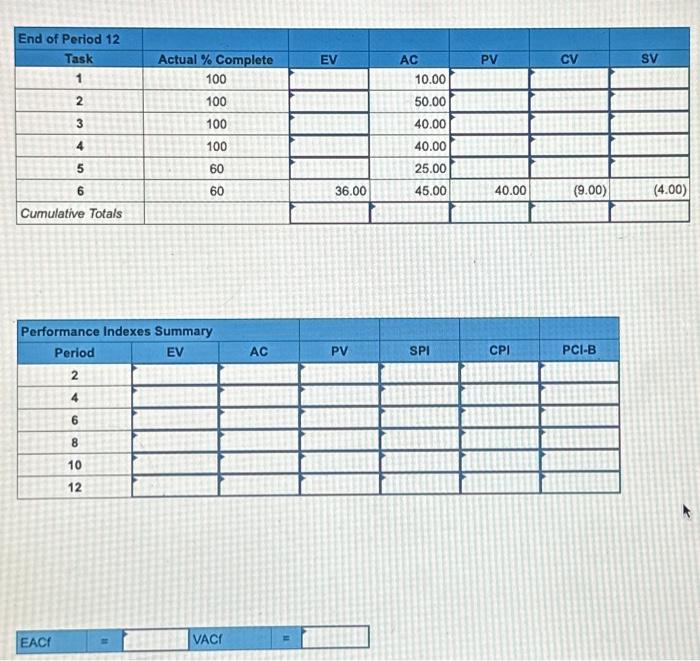 (Do not round intermediate calculations, Enter all values to 2 decimal precision. For SPI, CPI, and PCI-B, enter in decimals rather than percentage format. (i.e., enter 0.93 if the answer is 93% )) (Do not round intermediate calculations. Enter all values to 2 decimal precision. For SPI, CPI, and PCI-B, enter in decimals rather than percentage format. (i.e., enter 0.93 if the answer is 93% )) The following data have been collected for a British health care IT project for two-week reporting periods 2 through 12 . Compute the SV,CV,SPI,CPI, and PClB for each period. \begin{tabular}{|c|c|c|c|c|c|c|} \hline End of Period 8 & & & & & & \\ \hline Task & Actual \% Complete & EV & AC & PV & CV & SV \\ \hline 1 & 100 & & 10.00 & & & \\ \hline 2 & 30 & & 20.00 & & & \\ \hline 3 & 50 & & 25.00 & & & \\ \hline 4 & 0 & & 0.00 & & & \\ \hline Cumulative Totals & & & & & & \\ \hline \end{tabular} \begin{tabular}{|c|c|c|c|c|c|c|} \hline End of Period 10 & & & & & & \\ \hline Task & Actual \% Complete & EV & AC & PV & CV & sv \\ \hline 1 & 100 & & 10.00 & & & \\ \hline 2 & 50 & & 30.00 & & & \\ \hline 3 & 100 & & 45.00 & & & \\ \hline 4 & 55 & & 21.00 & 41 & & \\ \hline 5 & 0 & 0.00 & 0.00 & 0.00 & 0.00 & 0.00 \\ \hline 6 & 25 & & 24.00 & 110 & & \\ \hline Cumulative Totals & 43 & & 11 & & & \\ \hline \end{tabular} \begin{tabular}{|c|c|c|c|c|c|c|} \hline \multicolumn{7}{|l|}{ End of Period 12} \\ \hline Task & Actual % Complete & EV & AC & PV & CV & SV \\ \hline 1 & 100 & & 10.00 & & & \\ \hline 2 & 100 & & 50.00 & & & \\ \hline 3 & 100 & & 40.00 & & & \\ \hline 4 & 100 & & 40.00 & & & \\ \hline 5 & 60 & 8x & 25.00 & & & \\ \hline 6 & 60 & 36.00 & 45.00 & 40.00 & (9.00) & (4.00) \\ \hline Cumulative Totals & & & & & & \\ \hline \end{tabular} \begin{tabular}{|c|c|c|c|c|c|c|} \hline \multicolumn{7}{|c|}{ Performance Indexes Summary } \\ \hline Period & EV & AC & PV & SPI & CPI & PClB \\ \hline 2 & & & & & & \\ \hline 4 & & & & & & \\ \hline 6 & +4 & & 10 & & & \\ \hline 8 & & & & & 1 & \\ \hline 10 & & 11 & & & & \\ \hline 12 & & & & & & \\ \hline \end{tabular} EACf VACI
The following data have been collected for a British health care IT project for two-week reporting periods 2 through 12. Compute the SV, CV, SPI, CPI, and PCIB for each period. Task DUR 1 2 3 4 5 1 4 0 4 4 6 4 8 6 4 4 8 ES 0 4 4 4 10 8 4 2 6 4 0 4 2 12 2 8 14 3 10 0 6 10 4 8 2 2 6 4 10 4 LF 4 14 10 10 14 18 SL ON ON ON 2 E 00 PV ($00) 0 8 40 30 20 10 5 14 0 0 10 4 14 40 60 8 6 16 2 2 10 18 8 Baseline (PV) ($00) 4 2 4 4 10 10 14 0 14 15 10 10 7 6 8 10 12 10 10 10 4 5 18 0 18 on a un m 14 20 20 16 20 20 10 10 22 18 8 0 0 18 4 22 Legend ES ID EF SL SL LS DUR LF 18 20 22
Step by Step Solution
There are 3 Steps involved in it
Step: 1

Get Instant Access to Expert-Tailored Solutions
See step-by-step solutions with expert insights and AI powered tools for academic success
Step: 2

Step: 3
Ace Your Homework with AI
Get the answers you need in no time with our AI-driven, step-by-step assistance
Get Started
Understanding The Finance Of Welfare
Authors: Howard Glennerster
2nd Edition
1847421091, 978-1847421098