Answered step by step
Verified Expert Solution
Question
1 Approved Answer
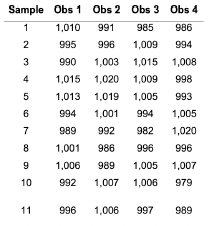
The following data (in milliliters) are the amount of liquid in the detergent bottles on an automated filling machine. Develop sample mean and sample range
The following data (in milliliters) are the amount of liquid in the detergent bottles on an automated filling machine. Develop sample mean and sample range control charts using the first 10 samples.
Is the process in control?
Use the control charts developed in part a to decide if the 11th sample (also given below) indicates an out-of-control situation.
 \begin{tabular}{ccccc} Sample & Obs 1 & Obs 2 & Obs 3 & Obs 4 \\ \hline 1 & 1,010 & 991 & 985 & 986 \\ 2 & 995 & 996 & 1,009 & 994 \\ 3 & 990 & 1,003 & 1,015 & 1,008 \\ 4 & 1,015 & 1,020 & 1,009 & 998 \\ 5 & 1,013 & 1,019 & 1,005 & 993 \\ 6 & 994 & 1,001 & 994 & 1,005 \\ 7 & 989 & 992 & 982 & 1,020 \\ 8 & 1,001 & 986 & 996 & 996 \\ 9 & 1,006 & 989 & 1,005 & 1,007 \\ 10 & 992 & 1,007 & 1,006 & 979 \\ & & & & \\ 11 & 996 & 1,006 & 997 & 989 \end{tabular}
 Step by Step Solution
There are 3 Steps involved in it
Step: 1

Get Instant Access to Expert-Tailored Solutions
See step-by-step solutions with expert insights and AI powered tools for academic success
Step: 2

Step: 3

Ace Your Homework with AI
Get the answers you need in no time with our AI-driven, step-by-step assistance
Get Started


